16 SEPTEMBER 2026
Behind the Price
The Print is a magazine about money, written from inside the markets it describes. This issue takes one number apart. Every figure in it is labelled by what it is: something we observed, something we calculated, something reported by somebody else, or something we are arguing. Twice the issue argues against itself, in its own voice, and does not answer back.
How to read this issue
| OBSERVED | Present in data we captured ourselves, on our own connection. The table and the instant are named. |
| CALCULATED | Derived by us from disclosed inputs. Set in vermilion, so it can be recognised before it is read. |
| REPORTED | Established from primary documents produced by somebody else: exchanges, regulators, administrators. |
| ARGUED | Our interpretation. It is allowed to be provocative. It is not allowed to borrow the other three labels. |
Numbers. A figure set in ink was observed. A figure set in vermilion was calculated by us from inputs you can see. Timestamps, sources and methods are set in mono. Prose is set in Inter, and voices, ours and other people's, in Fraunces.
The footer. Every page carries a stamp such as ONE SECOND · +0.063s · bybit printed 75,828.0. It is explained on page 6. By the end of the issue you will be able to read every word of it.
Generative tools. The illustrations in this issue were drawn with generative tools and read as illustrations. Those tools did not make any document, receipt, screenshot, trade, interview or market-data display. Where a number exists, it came out of a database we can open in front of you, or out of a named primary source.
Dissent. Twice in this issue the strongest case against it is set out and left standing. We write those pages ourselves, in the voice of the best opponent we can put up, and we do not reply to them.
SLVCE runs trading and liquidity infrastructure. It appears in this issue only as a method: its capture of market data, its willingness to publish that capture, and one bug in it that this issue found.
one second will pass.
| Venue | Unit | Best bid | Best ask | Quote age |
|---|---|---|---|---|
| coinbase | USD | 75,741.86 | 75,741.87 | 260 ms |
| gate | USDT | 75,806.10 | 75,806.20 | 238 ms |
| binance | USDT | 75,807.19 | 75,807.20 | 19 ms |
| bybit | USDT | 75,809.80 | 75,809.90 | 467 ms |
| okx | USDT | 75,810.90 | 75,811.00 | 181 ms |
One Second
Why a second
Markets are usually shown in days. A day suits a person and means very little to a market. By the time a day closes, everything inside it has been averaged into one candle, and the machinery that produced the number has been thrown away. This issue works at the other end of the scale.
How this one was chosen
We scanned six hours of our own bitcoin capture: 21,291 seconds with any activity in them. Each was scored on how many venues were live, how many events it held, and whether the sequence inside it could be followed: a cause, an effect, a response. 07:24:04 UTC scored highest. It was frozen to a file before a word of the issue was written, and nothing in it has been edited since.
A busy second was chosen because a busy second can be followed. It is not a typical one, and the issue does not pretend otherwise: an ordinary second from the same six hours, drawn at random from those with a median number of trades, sits beside it in the data room. That one holds 11 prints and $14,485, against 741 prints and $3.2 million here.
What was withheld
Kraken. It was connected and quoting throughout, but its order book in our capture is crossed, bids above asks, for 98.8% of the window. The cause was a bug in our own collector: it never deleted price levels that fell out of the depth it subscribed to. We found it while preparing this issue and fixed it the same day. Every Kraken quote in this second is unusable, so none is in the tables. Page 99 shows one of them anyway.
How to read the footer
The stamp is the time elapsed at that page, with time spread evenly over 112 pages. Beside it is the event we captured nearest that instant: a quote, with its best bid and ask, or a print, with the price it crossed at. By page 112 the second is over.
| Venue | Median print | Largest | Lowest price | Highest |
|---|---|---|---|---|
| binance | $152 | $494,258 | 75,807.2 | 75,844.0 |
| bybit | $583 | $36,819 | 75,809.9 | 75,849.0 |
| okx | $1,269 | $137,775 | 75,811.0 | 75,849.8 |
| coinbase | $1,202 | $27,022 | 75,741.9 | 75,770.8 |
| gate | $642 | $16,930 | 75,806.2 | 75,852.0 |
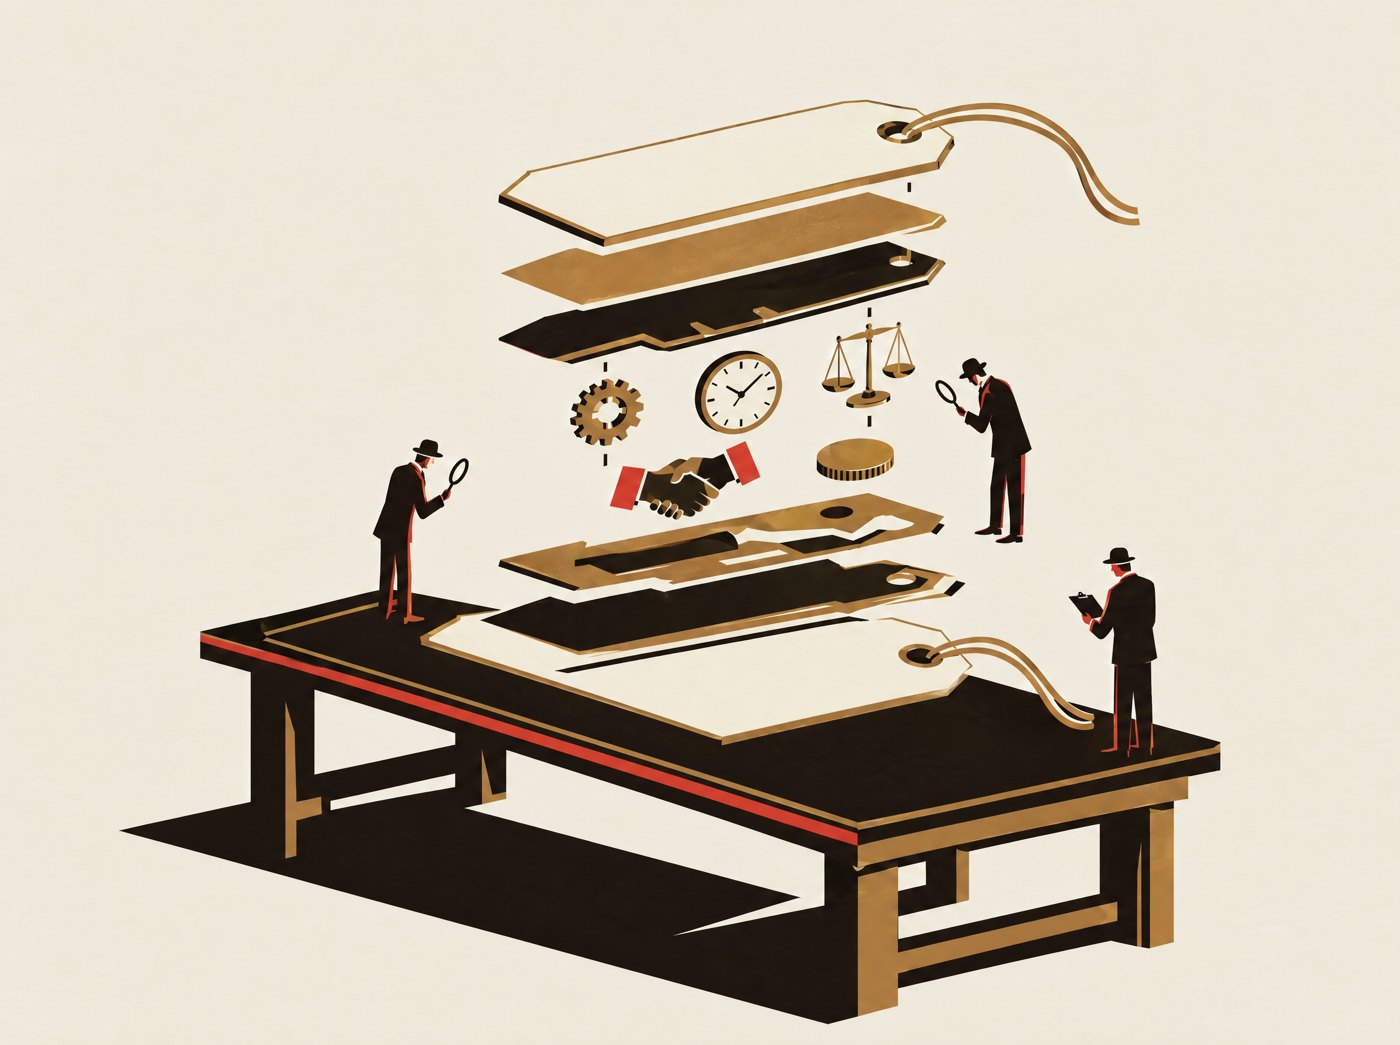
What Is a Price?
You look at a screen. Gold is one number, oil is another, bitcoin is a third. They sit in a neat column with small arrows beside them, and they look like facts of the same kind as the temperature. Says who?
A barrel of oil weighs about 136 kilograms. Gold has an atomic number of 79. At 07:24:04 on the morning of 16 September, a bitcoin on Binance cost $75,807.20. English grammar makes those three sentences sound alike. The barrel would weigh the same on an island with nobody on it. Gold had 79 protons before anybody counted them. The price of a bitcoin was true only because, at that instant, somebody was prepared to sell one at that figure and nobody had yet taken them up on it.
A price needs a surprising amount of company. It needs a buyer and a seller. It needs a place where they can find each other, and rules for what happens when they do. It needs a unit to be written in, a clock to be
stamped with, and enough people standing behind it for the number to hold at more than a trivial size. It needs a promise that what was agreed will be delivered. In most markets today it also needs a piece of software deciding which of many candidate numbers is the one the rest of the world gets to see.
Take away any one of those and the number does not become wrong. It stops existing.
Start with the screen
Most of the prices you see were not made where you are seeing them. A phone showing the price of bitcoin, a news ticker showing Brent crude, a bank app showing the value of a fund: each is a display. Behind the display is a feed, and the feed is usually repeating somebody else's number, chosen by rules the display does not mention.
Some of those numbers are the last price at which something traded. Some are the midpoint between the best offer to buy and the best offer to sell. Some are an index: several venues averaged, with the outliers trimmed away. Some are a mark, a figure an exchange computes to settle who owes whom on a futures position, and which is designed on purpose not to follow the last trade. All of them are called the price, and at any given moment they are routinely different numbers.
Go one floor down
Underneath an index are venues, each running its own market. Underneath each venue is an order book: two queues of standing offers. On one side are people who want to buy, each with a price and a quantity. On the other are people who want to sell. The highest bid and the lowest ask face each other across a small gap called the spread. While the gap is open, nothing trades. A trade happens when somebody decides to cross it.

Underneath the book are orders, and underneath the orders are decisions: a person, a fund, a company buying raw materials, or more often now a program told what to want. A price on a screen is the most recent visible residue of those decisions, passed through several layers of rules and delivered to you some milliseconds or some minutes after they were made.
This issue takes one second of one market and pulls that stack apart. One second, captured on our own hardware, frozen to a file and published with the issue. Between 07:24:04.000 and 07:24:04.999 UTC on 16 September 2026, five venues we connect to directly were all quoting bitcoin. Between them they printed 741 trades and moved $3,203,956. No two of them agreed on the price, and the two that disagreed most were not really disagreeing about bitcoin.
The disagreement is in the unit
When the second opens, the five best bids span $69.04: 9.1 basis points, on an asset most people think simply has
a price. Tempting to call that fragmentation and move on.
Mostly it isn't. Four of those five venues do not quote bitcoin in dollars. Binance, Bybit, Gate and OKX price it against tether, a token issued by a company and intended to be worth one dollar. Coinbase, alone in our set, prices it against bank dollars. Line up the four tether venues and their best bids span $4.80, or 0.63 basis points. Put Coinbase back and the span jumps to $69.04, because Coinbase is quoting a different pair.
So $69.04 comes apart into two numbers. $64.24 of it is the price of a dollar, measured in tether. $4.80 is the price of a bitcoin being worked out in four places at once.
Tether is a claim on a company. Verified customers above a minimum size can hand tokens back and receive dollars; nearly everybody else cannot, so they trade the token instead. Its price against the dollar is therefore a price like any other, made by people willing to act, and it sits inside every quote on four of our five venues whether or not a screen mentions it. On this morning it came to about eight and a half basis points.
That part is stable, and firms arbitrage it all day for a living. The $4.80 is the live part. Get used to the shape: this issue keeps finding one number on the screen and two underneath, and the smaller one is usually the story.
And the rest is in the clock
There is a second problem with reading five quotes as five simultaneous opinions. They were not simultaneous.

A quote is the last message a venue sent, held on our side until the next one arrives. At the instant our second begins, the best bid on Binance was 19 milliseconds old. On Bybit it was 467 milliseconds old, close to half a second, which in this market is a long time. Coinbase was at 260, Gate at 238, OKX at 181.
So the row on page 11 holds five answers to five slightly different questions, asked at different moments and set on one line by us, because people read lines. Every market-data screen does this. Very few show the ages.
Nothing went wrong in our capture. A venue sends a message when its book changes; between messages there is nothing to send, and the last number stands. On the wire, a quiet venue and a broken venue look identical. That is why this issue withholds one venue entirely, and why page 99 shows what its broken quotes looked like.
Ask it how much
Ask what $75,807.20 buys and the number dissolves in another direction. It is the price of the top of one book: the best offer, for
whatever quantity happens to be resting there, and not one unit more.
In our second the median print was 0.0077 bitcoin, about $583. At that size the price on the screen and the price paid are the same number. The largest print was 6.51994 bitcoin on Binance, 67 milliseconds in, worth $494,258. In the last snapshot of Binance's book before the second, 6.83704 bitcoin were offered at exactly $75,807.20, so that trade fitted inside the best offer and paid the screen price. A buyer a few bitcoin larger would have paid more for the last of them.
741 prints crossed in that second. The smaller half, 370 trades, carried 1.46% of the money. The largest seven, one per cent of the count, carried 29.9%. The tape is mostly transactions that move almost no value, punctuated by a few that move nearly all of it, and every one of them prints in the same size of type.
The smallest trade we captured was 0.00000003 bitcoin on Coinbase, 896 milliseconds in: about a quarter of a cent, real, settled. On a chart it counts exactly as much as the half-million-dollar one, because a chart of prices has no column for size. Act II is about that missing column.
What the screen leaves out
So one quote carries a lot it never says. It has a unit, which may not be the one you assume. It has an age, which is never displayed. It has a size, which is almost never displayed. It comes from one venue, or from a rule that combines several. And it sits on a stack of decisions made by people and programs who are not visible at all.
Nobody is hiding anything. A screen with every footnote would be unreadable, and whether bitcoin was $75,807 or $75,844 at breakfast changes nothing for most people. The trouble lives at the edges, and so does the rest of this issue: large sizes, thin books, contracts, and the rare hours when a market stops and a number that was a price a minute ago stays on the screen as decoration.
The discipline this issue asks for is small. Whenever a price matters, ask five questions of it. In what unit? From where? How old? Good for how much? Made by what rule? Most of the time the answers are boring. When they are not, the number was never telling you what you thought.
So what was the price?
By the end of the second all five venues had moved up, none by the same amount. The Binance offer that opened at $75,807.20 closed at $75,844.01. Ask at the start of the second what a bitcoin cost and there were five true answers. Ask at the end and there were five different true answers. Nothing about bitcoin had changed. Plenty about the market had.
Weight belongs to the object. A price is a result: of who was willing to act, where, in what unit, at what size and when, and of who reported it, after how long. The rest of Act I stays with the number itself. It asks what happens when a price is calculated instead of traded, when it goes below zero, and when somebody has to decide, officially, which number counts.
Price is not something an object has. Price is something a market does.
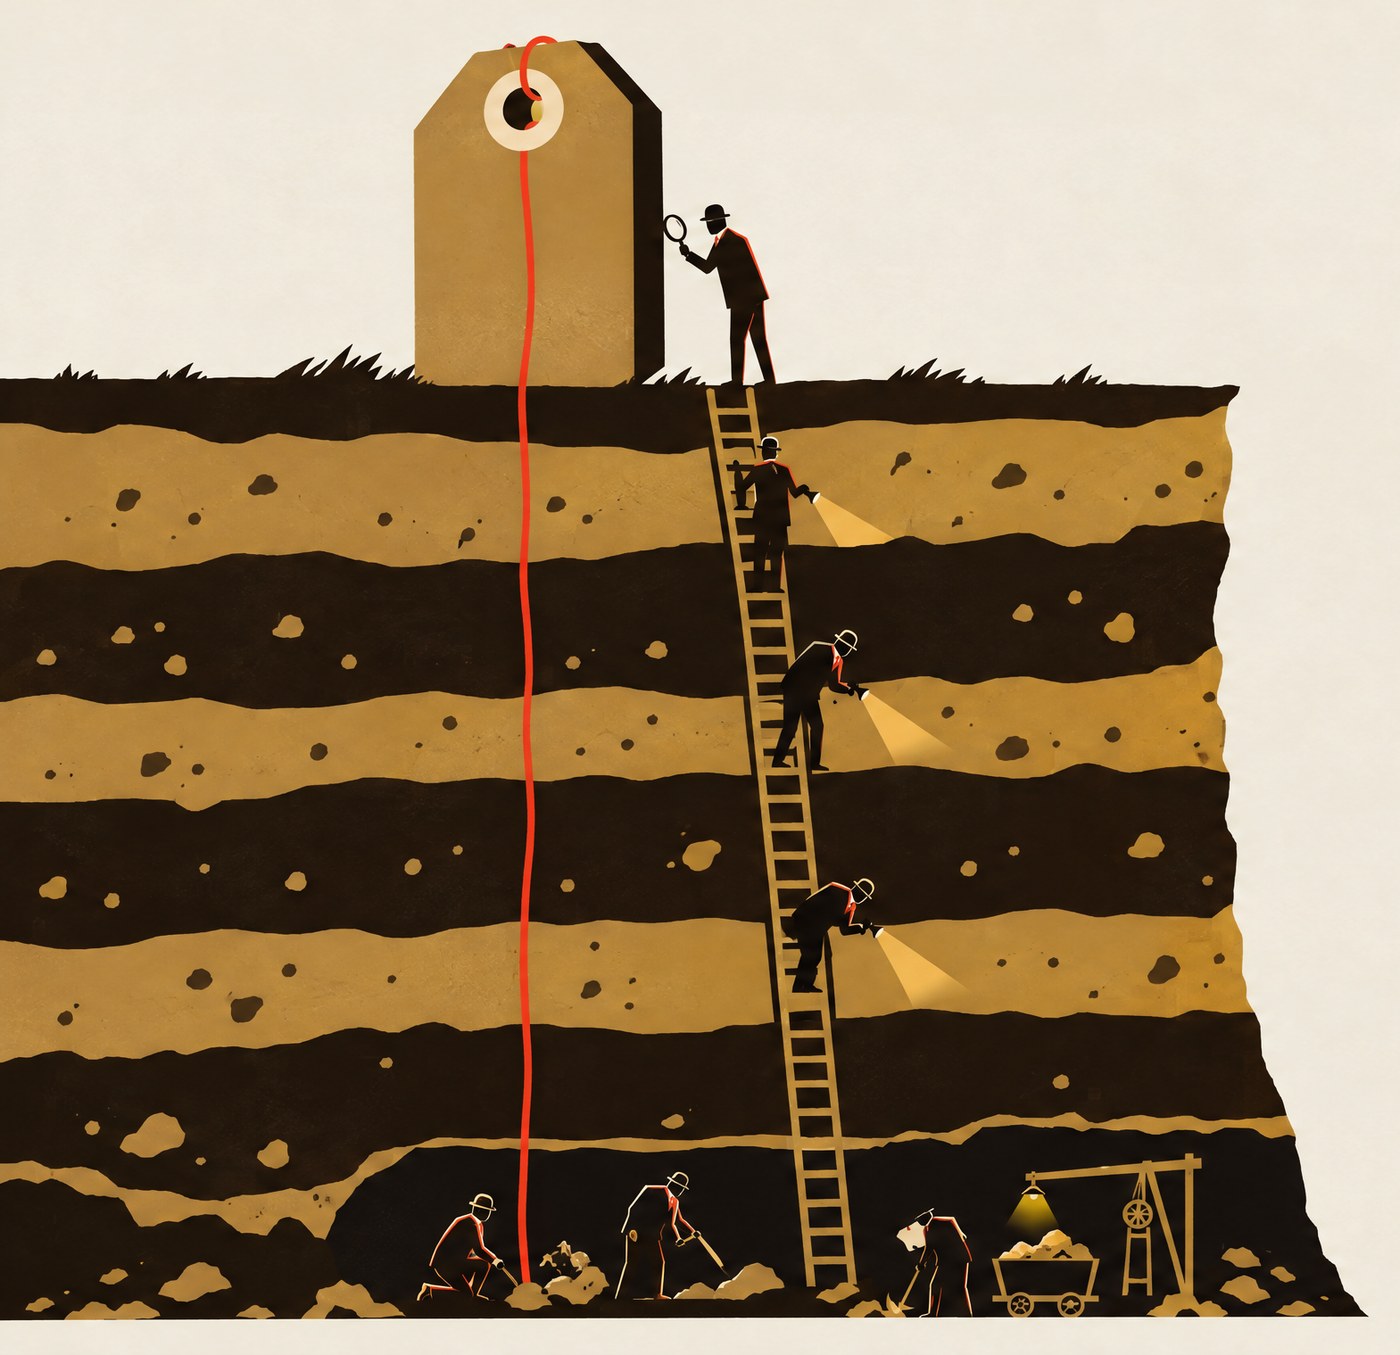
| 01 | Displayed price | What a screen shows: one number, no unit, no size, no age. | $75,807.20 | binance ask |
| 02 | Mark / index | What a system would compute from many screens. Our own recorded it 1.227 s late, from a half-cent midpoint nobody could trade. | $75,807.195 | page 21 |
| 03 | Unit | Four venues price in tether, one in bank dollars. The gap between them at T+0. | $64.24 | not bitcoin |
| 04 | Venues | Five venues live, one withheld. Spread across the four that share a unit. | $4.80 | 0.63 bp |
| 05 | Order book | Offered at the top of Binance's book in the last snapshot before the second. | 6.83704 BTC | one level |
| 06 | Orders | Prints in the second. The largest seven carried 29.9% of the money. | 741 | prints |
| 07 | People and machines | Who sent them. Our capture cannot see a single one. | unknown | we don't know |
| ms | venue | price | BTC |
|---|---|---|---|
| +36 | bybit | 75,809.9 | 0.245796 |
| +36 | bybit | 75,809.9 | 0.019000 |
| +36 | bybit | 75,811.2 | 0.001932 |
| +37 | bybit | 75,817.5 | 0.002405 |
| +38 | bybit | 75,819.5 | 0.000400 |
| +40 | bybit | 75,824.2 | 0.009330 |
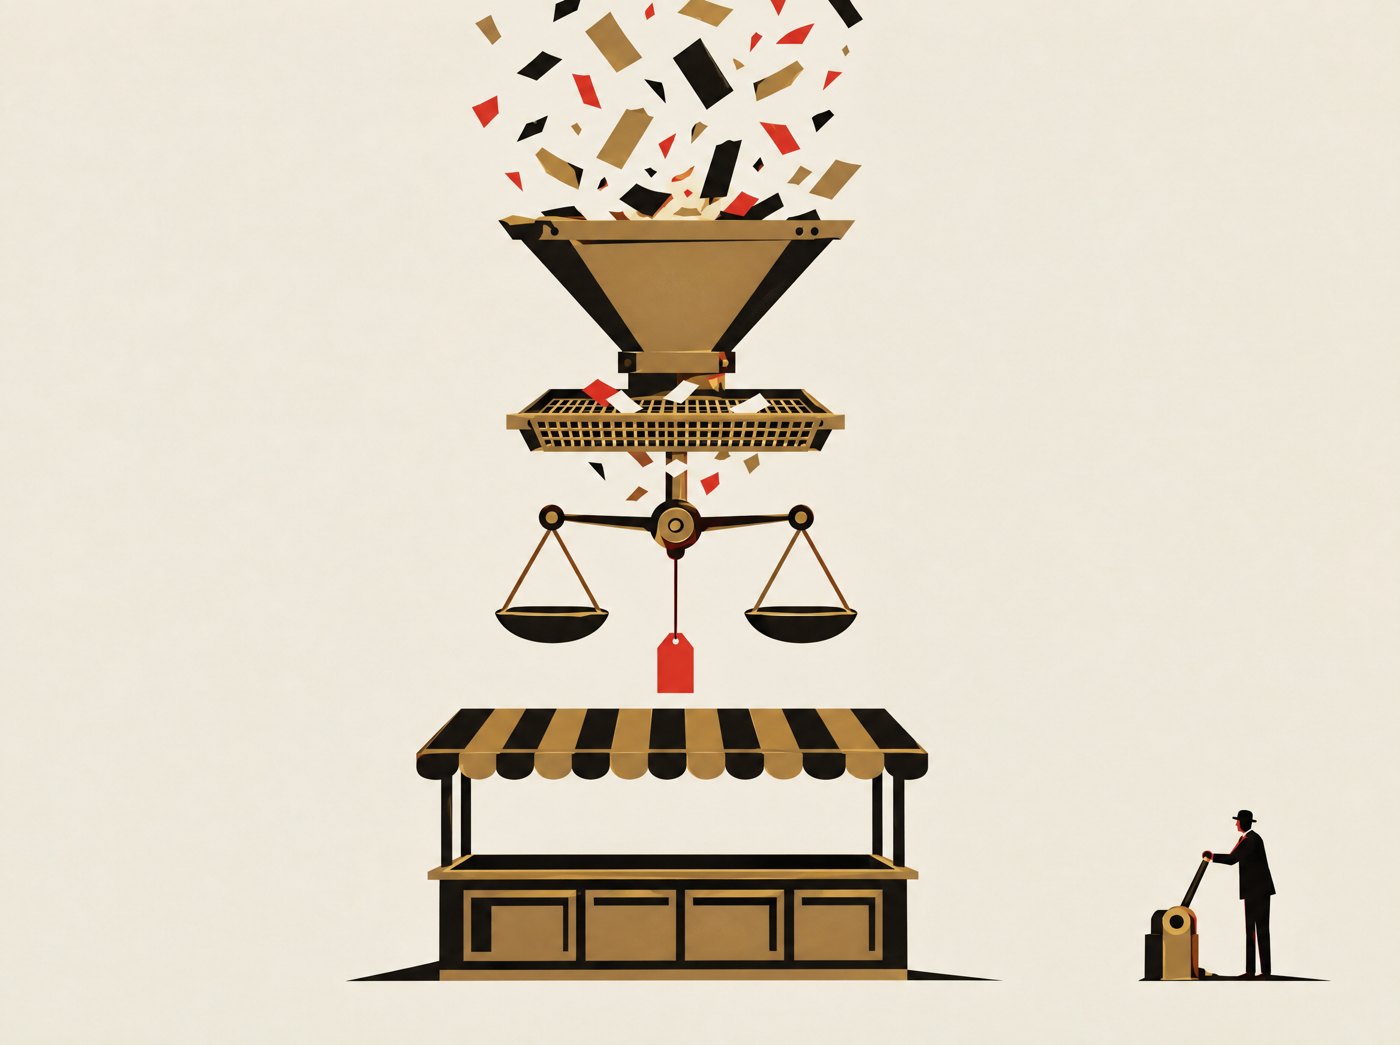
The Price That Never Traded
There are prices at which nobody bought anything. They are not rare, and they are not errors. Some of the most important numbers in finance are of this kind, and most people who rely on them have never noticed.
An index level is one. So is the mark price an exchange uses to decide whether your futures position has run out of margin. So is the net asset value of a fund, struck once a day from somebody else's prices. So is a volume-weighted average price, the benchmark a broker is judged against, and a fair value an auditor signs off for an asset that has not traded in months. Each is computed. None needs a buyer and a seller to have met at that figure.
Here is one from our second. Take every print on the four tether venues between 07:24:04.000 and .999, weight each by its size, and average. The answer is $75,822.48. It is a perfectly reasonable
description of where bitcoin changed hands in that second, and it is the kind of number an execution desk would be measured against. Of the 651 prints that produced it, none crossed at that price. 8 came within fifty cents of it.
No paradox there: the average of 3 and 5 is 4, and nobody had to hold a four. It does raise the question this article is about, though. Can a price be real if nobody ever paid it?
Why a trade is not enough
The obvious answer is that the last trade is the only honest price, and everything else is modelling. Our own second shows why nobody who runs a market believes that.
Remember the quarter-cent trade from page 13. Had it crossed a few dollars away from everything else, it would have been the last trade for a moment. If futures positions were settled against the last trade, a quarter-cent transaction on a thin venue could decide whether somebody else's position worth millions was liquidated. That is exactly the attack mark prices are built to resist.
So a derivatives exchange does not mark to its own last trade. It builds a mark from an index of spot venues, usually several, usually with outliers discarded and stale sources dropped, and then smooths it. The mark is designed to be harder to push around than any single print. It is a price at which nobody traded, deliberately, because a traded price was too easy to fake.
A fund faces a different version of the same problem. Its investors need one number a day to buy and sell units at. The assets inside it trade at different times, in different places, and some hardly at all. The fund's administrator takes a set of chosen reference prices at a chosen moment, applies them, subtracts fees, divides by units outstanding, and publishes. SPDR Gold Shares, the largest gold fund, values its metal once a day at the LBMA Gold Price set in the afternoon auction in London. The fund's NAV is a price nobody paid, built on a benchmark that, as page 29 describes, is itself a small machine.

Sources, filters, weights, output
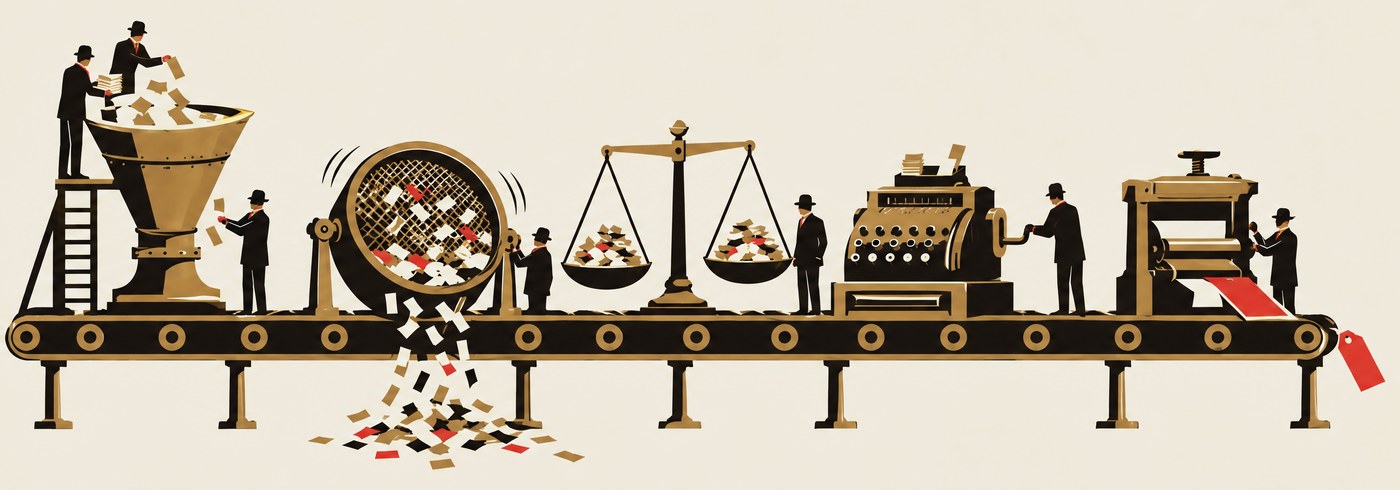
Every constructed price, from an index to an oracle feeding a lending protocol, is built the same way. Somebody chooses sources. Somebody writes filters that decide which observations to throw away: too old, too far from the others, too small, from a venue that has stopped answering. Somebody chooses weights. A calculation runs, and a number comes out with a timestamp on it.
Each of those choices is a judgement, and each can be defended. A median ignores one crazy venue; a mean does not. A volume weighting follows where the money is; it also follows where wash trading is. A tight staleness filter protects against frozen feeds and throws away honest quiet ones. The choices are published for the benchmarks that matter most, and it is worth
 SourcesFiltersWeightsCalculationOutput
| Price | Sources | Rule | What it decides |
|---|---|---|---|
| Index | several venues | median or weighted mean | a level |
| Mark price | an index of spot venues | smoothed, outliers removed | margin and liquidation |
| NAV | reference prices at a set time | holdings minus fees over units | fund dealing price |
| VWAP | every trade in a window | weighted by size | execution benchmark |
| Fair value | comparables and models | a person signs it | a balance sheet |
- Lastthe price of the most recent trade, of any size
- Bid / askthe best standing offers to buy and to sell
- Midhalfway between them; nobody can trade there on a one-tick spread
- Markan exchange's own settlement price for margin, built to resist single trades
- Indexseveral venues combined by a published rule
- VWAP / TWAPaverage trade price weighted by size, or by time
- NAVa fund's holdings at reference prices, less fees, per unit
- Fair valuean accounting estimate where there is no active market
reading them, because they are the difference between two numbers that both claim to be the price of the same thing.
CF Benchmarks, which calculates the bitcoin reference rate CME futures settle against, is a useful example of how specific those rules get. Its daily rate takes trades from a set of constituent exchanges over one hour, splits the hour into twelve five-minute partitions, takes a volume-weighted median in each, and averages the twelve equally. No trade needs to have happened at the result. Several billion dollars of futures settle on it anyway.
Our own number
We should declare our interest here, because our own systems make constructed prices, and our capture of this second contains one.
One of our collectors records a reference price for bitcoin every ten seconds, for risk checks. For 07:24:04 it recorded $75,807.195. The source field reads binance-fallback: the oracle we would prefer was not the one used. The figure is the midpoint of Binance's best bid and ask at the start of the second, and it has half a cent in it. Binance quotes in whole cents, so no trade could ever have happened at that price. The row reached our database 1.227 seconds after the instant it described, by which time Binance's best offer was $75,844.01.
Nothing about that is broken. The row is labelled honestly: where the number came from, when it was published, how old it was on arrival, and whether it passed our checks. Often the most useful price has no transaction behind it at all, only a statement with its provenance attached, and it deserves exactly as much trust as that provenance is complete.
The accountants got there first
Accounting standards settled this argument long ago, and their answer is worth borrowing. Both the international and the American rules for fair value sort every measurement into three levels. Level 1 is a quoted price in an active market for an identical asset: a traded price, used as it stands. Level 2 uses observable inputs that are not quite that, such as quotes for similar assets or prices from markets that trade rarely. Level 3 uses inputs that cannot be observed at all, and relies
on a model and the judgement of whoever runs it.
Every one of the three levels produces a number called fair value, and all of them end up on a balance sheet in the same column. The standards insist that the level is disclosed, precisely because the numbers look identical once printed. A reader of a bank's accounts who does not look at how much of its assets are valued at Level 3 is reading a list of prices without the one piece of information that says how much each deserves to be believed.
Market screens could learn from it. This issue borrows it for its own figures: observed, calculated, reported, argued. Attach the level and a number tells you how far to trust it. Leave it off and the number asks for trust it has not earned.
So is it real?
A constructed price is real in the only sense a price can be: people act on it. Positions are liquidated at marks, fund units are bought and sold at NAVs, trillions of dollars of loans have reset against benchmark rates. Nobody paid the number, but a great many people paid because of it.
What changes is where the risk sits. With a traded price, the question is whether the market was deep enough to mean anything. With a constructed price, the question is who chose the sources, who wrote the filters, and what they stood to gain from the answer. That second question has an unhappy history, and it is the subject of page 27.
Before that, one more thing a price is supposed to be unable to do.
Below Zero
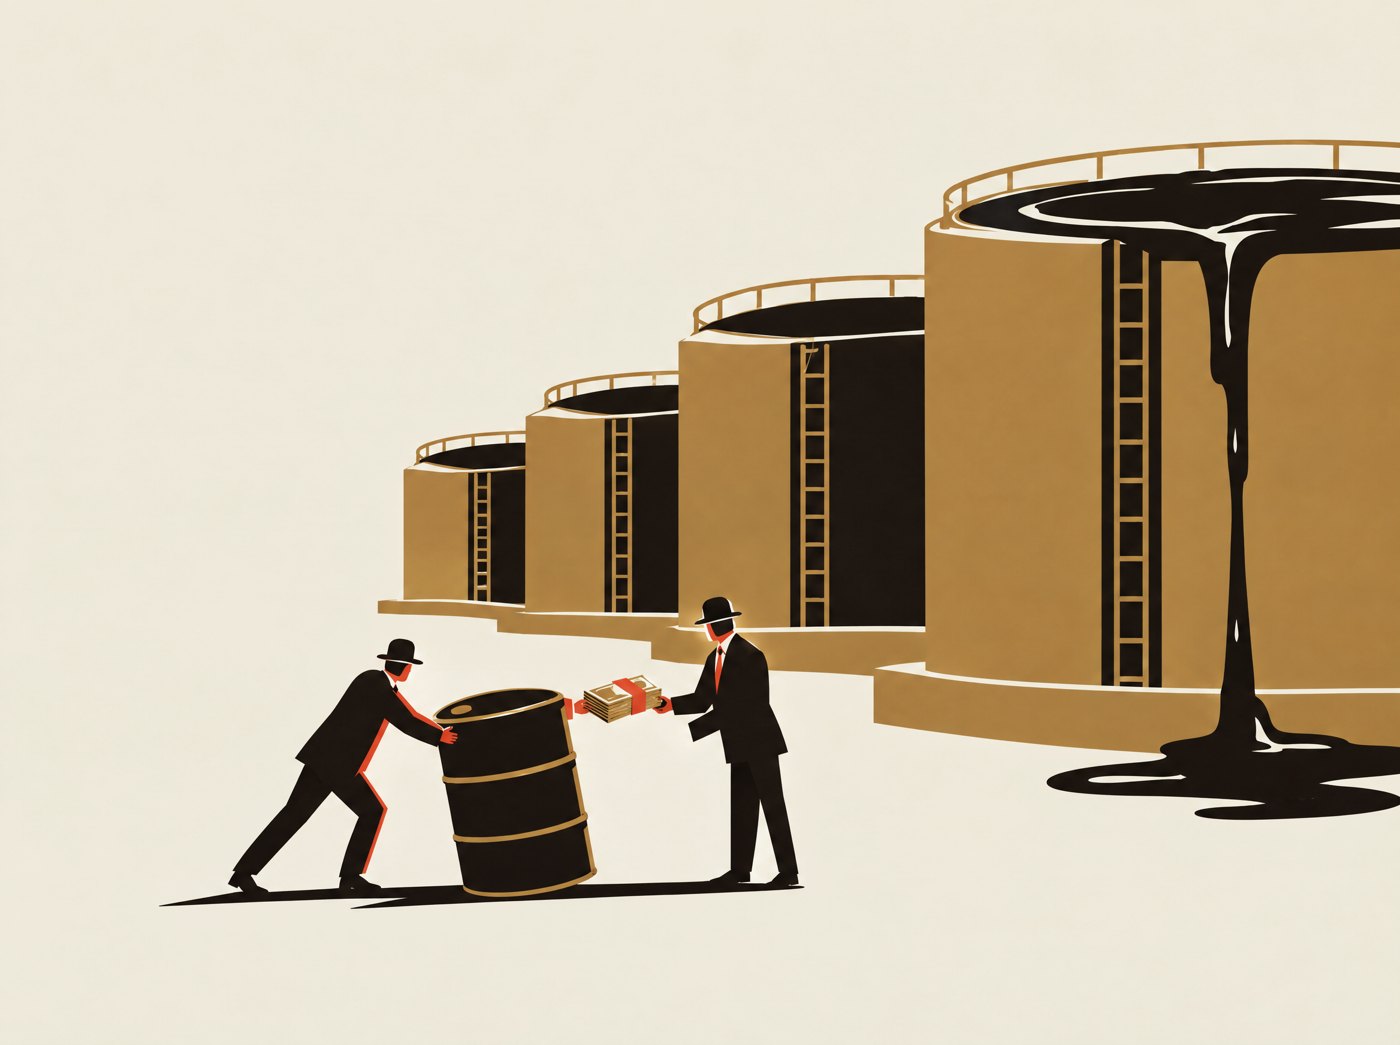
On 20 April 2020, oil did not merely become worthless. For some contracts, getting rid of it became valuable.
It is 2:30 in the afternoon in New York. The May contract for West Texas Intermediate crude on the New York Mercantile Exchange settles at minus $37.63 a barrel. On Friday it settled at $18.27. Today it has traded as low as minus $40.32. Tomorrow, its last day of trading, it will expire at $10.01. Right now, anyone holding a contract to receive a thousand barrels of oil in May can get out of it only by paying somebody else nearly $38,000 to take it.
The headlines said the price of oil had gone negative. That is almost right, and the part that is wrong is the whole story.
What the contract actually was
Forget oil in general. A WTI futures contract is an agreement to take or make delivery of a thousand barrels of a specific grade,
during a specific month, at a specific place: Cushing, Oklahoma, a town of tanks and pipelines where much of the crude in the middle of the United States passes through. Most people who trade the contract never intend to see the oil. They sell or roll their position before it expires. The ones still holding at expiry either have somewhere to put a thousand barrels, or find somebody who does.
In April 2020 the world had stopped driving and flying. Demand collapsed faster than production could be shut in, and the oil had to go somewhere. Storage everywhere was filling, and the market's fear was that the tanks at Cushing would be full by May. The US Commodity Futures Trading Commission's staff later described an oversupplied market, an unprecedented fall in demand, and concern about the availability of storage, all arriving at once on the day before expiry.
For a holder of the May contract with nowhere to store the oil, the calculation on the afternoon of 20 April had stopped being what oil was worth. It had become what it would cost to avoid receiving it. Past a certain point, paying a stranger to take the obligation was the cheapest option available. The CFTC staff found the fastest part of the fall happened between 1:00 pm and the 2:30 pm settlement.
It was never the price of oil
On the same afternoon, the June contract for the same grade at the same place traded above $20. Oil a month later was worth a positive amount. Oil that had to be taken now, with no tank to put it in, was worth less than nothing. Same crude, same town. What differed was time, place and a tank: the three things the word price usually hides.
The minus sign was a truthful report of a physical problem. The barrels had not lost their energy content. What had gone negative was the right to receive them at a moment when receiving them was a liability. A futures price describes a contract, and a contract describes an obligation, and an obligation can be worth avoiding.
Other ways below zero
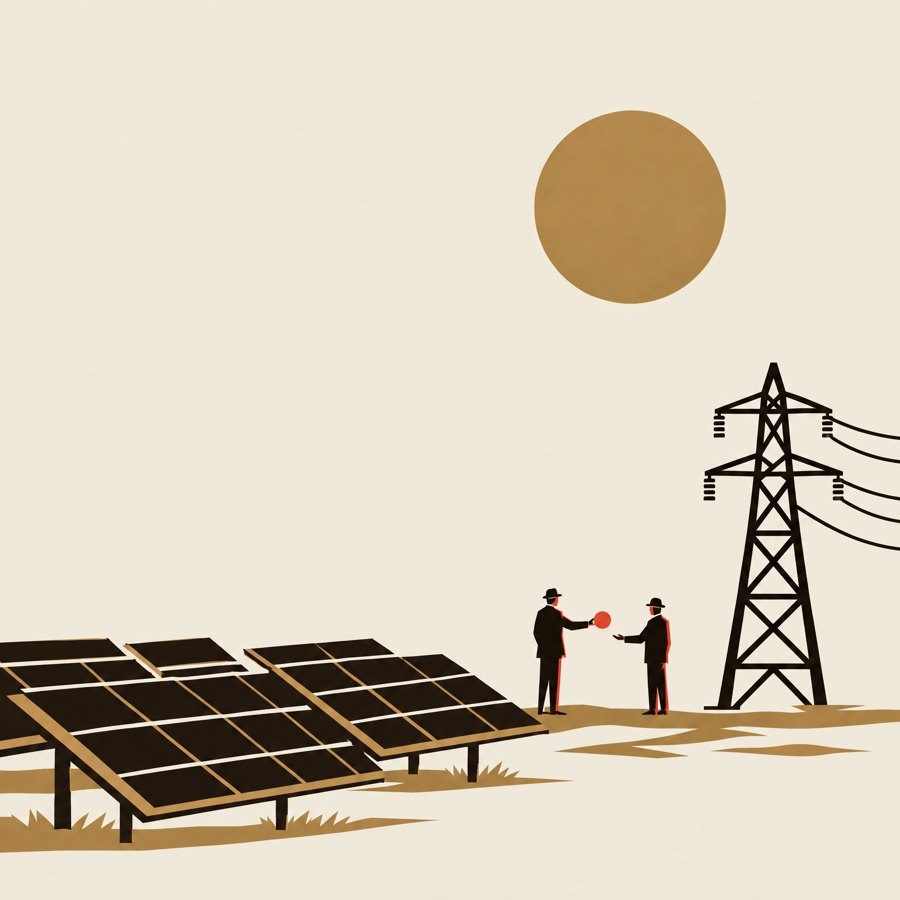
Electricity goes below zero routinely now. Germany recorded 457 hours of negative wholesale prices in 2024, up from 301 in 2023, according to its Federal Network Agency, mostly around midday in summer when solar output peaks. Power cannot be stored cheaply at scale. Some plants are expensive to switch off and on again, and some generators are paid for output under support schemes regardless of the market price. At those hours, paying somebody to consume a megawatt-hour is cheaper than the alternatives, and the price says so.
Negative interest rates look similar and work differently. The European Central Bank set its deposit rate below zero in June 2014 and kept it there until July 2022. The Bank of Japan's policy rate was negative from 2016 until March 2024. Those were administered rates, chosen by central banks as policy, and what they priced was the cost of holding money at the central bank. They are relatives of the oil episode, cousins
rather than twins, and it would be sloppy to call them the same mechanism.
The systems that assumed zero
A good deal of financial software had been written on the assumption that prices cannot fall below zero. It is a natural assumption for shares, which have limited liability, and for most physical goods most of the time. Order entry systems rejected negative numbers. Risk models took logarithms of prices, which do not exist for negative values. Option pricing models used by exchanges assumed that prices are always positive.
In the days before 20 April 2020, CME Group told market participants that its systems could handle negative prices in energy futures and options, and after the event it switched the model it used to value some energy options to one that allows prices below zero. Brokers and platforms that had not prepared found their own systems unable to display, margin or close positions at the prices the exchange was printing.
Funds that held the front-month contract had a structural version of the same problem. An exchange-traded oil fund that owns near-dated futures must sell them before delivery and buy later ones. When the near contract collapses relative to the next, that roll is expensive, and after April 2020 the largest US oil fund moved its holdings spread across later months. The minus sign did not only change a price. It changed which prices people were willing to hold.
What the minus sign teaches
It is tempting to treat April 2020 as the day a market went mad. It is more useful as the day a market was unusually honest. Most of the time a price quietly blends the value of a thing with the cost of holding it, moving it and waiting for it, and those costs are small enough to ignore. That afternoon the costs were larger than the thing.
Once a price can fall below zero, the idea of intrinsic worth has to go. What is left is what somebody would give, under constraints, to be on one side of a contract.
Who Owns the Number?
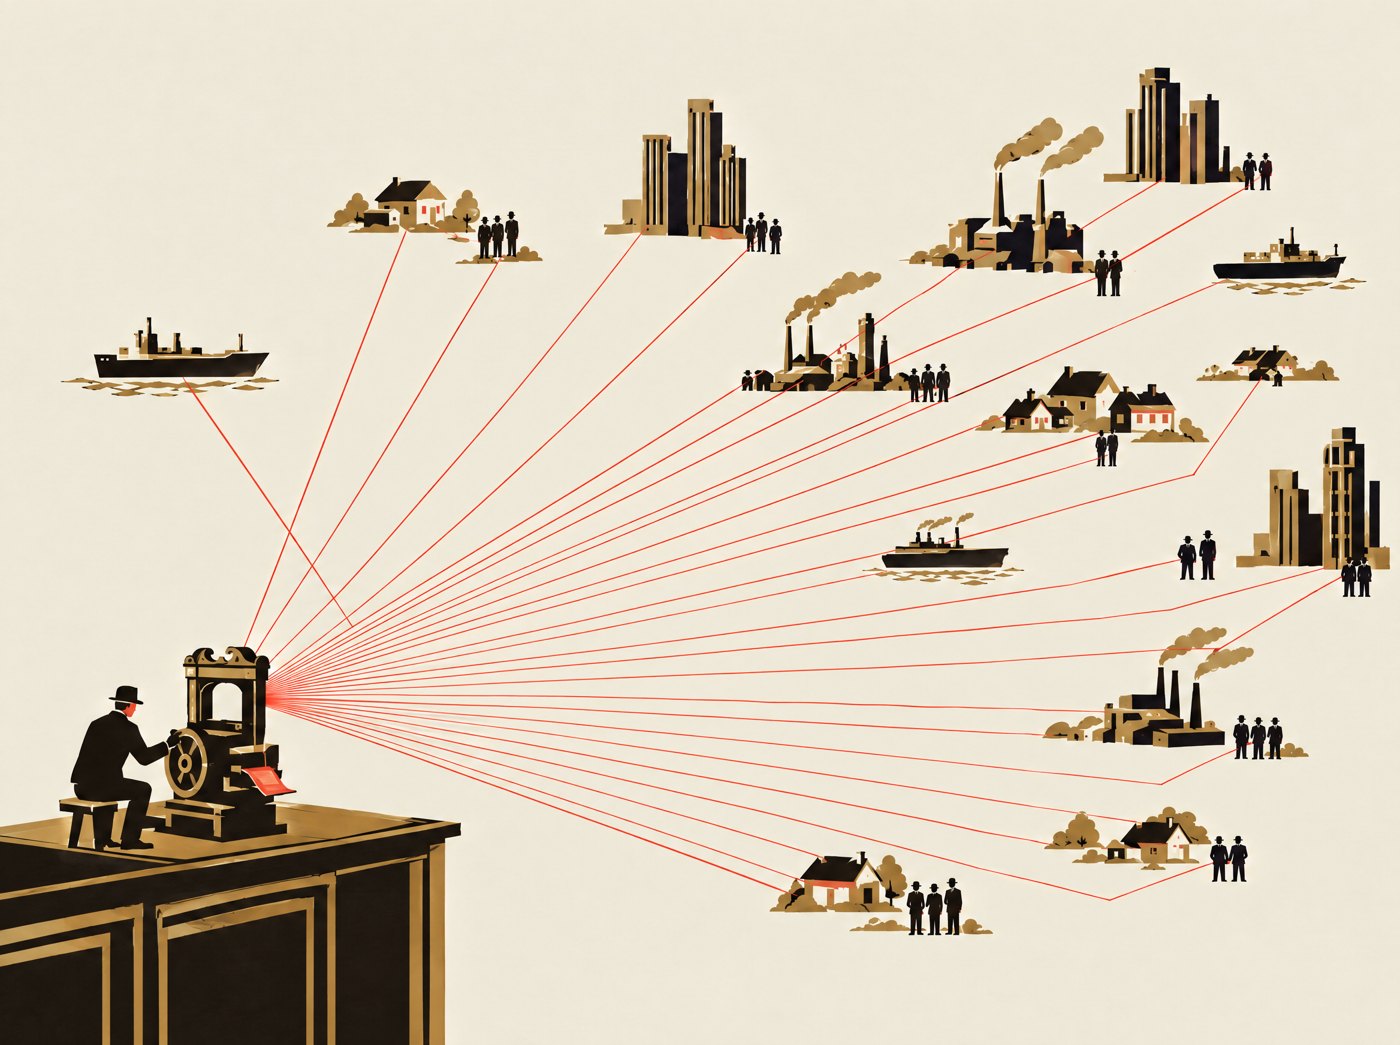
If prices can be constructed, somebody writes the construction rules. For most of the numbers that matter, that somebody is a small organisation almost nobody outside finance has heard of, working from a methodology document almost nobody has read.
Modern finance runs on reference numbers. A mortgage resets against a rate. A pension fund owns a slice of an index and is judged against it. A mine sells its gold at a benchmark. A futures contract settles against a reference rate. A lending protocol on a blockchain liquidates a borrower when an oracle says the collateral has fallen far enough. None of these contracts names a trade. Each names a number, and a procedure for producing it.
Once a number decides who pays whom, the procedure stops being a technicality. Somebody specifies the inputs. Somebody specifies the rule. Somebody runs it and publishes. Every one of those roles creates an incentive, and every incentive a failure
mode. Governance, the unglamorous business of who is allowed to do what and who checks, becomes a piece of market infrastructure as real as a matching engine.
The rate that was asked, not traded
LIBOR, the London Interbank Offered Rate, is the case everybody learns, for good reason. From 1986 it was published under the British Bankers' Association, and for decades it sat underneath an enormous range of contracts: interest rate swaps, syndicated loans, floating-rate notes, student loans and American adjustable-rate mortgages. The US regulators' own working group estimated in 2018 that around two hundred trillion dollars of financial contracts referenced US dollar LIBOR.
Nothing ever traded at LIBOR. Each morning a panel of banks was asked, in effect, a hypothetical question: at what rate could you borrow funds, were you to do so by asking for and then accepting interbank offers in a reasonable market size just before 11 am London time? Each bank submitted a number. The highest and lowest quarter of submissions were thrown away, the middle was averaged, and the result was published for each currency and each borrowing period.
The design had a logic. Banks did lend to each other unsecured, but not in every currency and every maturity every day, so a survey of informed estimates could cover gaps that transactions could not. Trimming the extremes meant one strange answer could not move the result much.
The design also had two flaws that nobody had to be a villain to exploit. The submissions were judgements, so they could not be proved wrong. And the banks submitting them held positions whose value depended on the answer.
What went wrong
Two kinds of pressure turned out to act on the number. In 2007 and 2008, a bank that submitted a high borrowing rate was telling the world it was in trouble. Some banks submitted lower rates than they could really borrow at, protecting their reputations at the moment it mattered most. Separately, and for years, derivatives traders at some banks asked the colleagues who made the submissions to nudge them up or down a little on days it suited their positions, and in some cases coordinated with traders at other banks.
In June 2012 Barclays settled with British and American authorities for a combined sum of around £290 million, and the internal messages published alongside made the mechanics painfully concrete. Other banks followed with far larger settlements. The UK's Wheatley Review recommended in September 2012 that submitting to and administering LIBOR become regulated activities. ICE Benchmark Administration took over as administrator in February 2014, and submissions were anchored to transactions wherever they existed.
 LIBORSOFRGoldCloseS&P 500BRROracle
| Output | Input | Rule | Administrator | Dependencies |
|---|---|---|---|---|
| LIBOR (USD) | Bank submissions to a hypothetical question | Trim top and bottom quarter, average the rest | BBA, then ICE Benchmark Administration | ~$200tn of contracts (2018 est.) |
| SOFR | Overnight Treasury repo transactions | Volume-weighted median | Federal Reserve Bank of New York | Loans, swaps, futures |
| LBMA Gold Price | Bids and offers from auction participants | Electronic auction until balanced, 10:30 and 15:00 | ICE Benchmark Administration | Mine contracts, fund NAVs |
| Closing price | Orders sent to the closing auction | Single price maximising matched volume | The listing exchange | Fund valuations, index levels |
| S&P 500 | Eligible US companies | Committee selection, float-weighted | S&P Dow Jones Indices | Index funds, futures, options |
| CME CF BRR | Trades on constituent crypto exchanges | 12 five-minute medians, averaged | CF Benchmarks | CME bitcoin futures settlement |
| On-chain oracle | Off-chain venue prices | Code-defined filters and aggregation | Oracle operator or network | Loans, liquidations |
A contributor at each panel bank considers the question for each currency and maturity: at what rate could this bank borrow, by asking for and accepting interbank offers in reasonable size?
Submissions go to the calculation agent. No transaction has to back them.
For each rate, the highest and lowest quarter are discarded. The remaining submissions are averaged with equal weight.
Rates are published to data vendors and flow into contracts, loan resets and valuation systems worldwide.
A submission is an opinion, so it cannot be shown false. Submitters sit in banks whose positions gain or lose with the number.
Low-balling to look healthy in the crisis; traders asking for nudges on days it suited them. Barclays settles in June 2012.
ICE Benchmark Administration takes over, submissions anchored to transactions. The USD panel ends on 30 June 2023.
It was not enough to save the number. The unsecured interbank lending LIBOR was supposed to describe had shrunk to the point where most submissions could not be tied to real trades. Regulators pushed markets to move to rates built from transactions. The US dollar LIBOR panel ended on 30 June 2023.
What replaced it, and what it solves
The replacement for dollar LIBOR is SOFR, the Secured Overnight Financing Rate, published by the Federal Reserve Bank of New York since April 2018. Transactions go in, not answers: the rate on overnight loans secured by US Treasury securities in the repo market, taken as a volume-weighted median across trades that in 2026 have run to roughly three trillion dollars a day.
It solves the problem LIBOR died of. A median of that many real transactions is very hard to push, and nobody has to guess. It also changed what the number describes. SOFR is overnight and secured against government bonds, so it contains almost no bank credit risk. LIBOR, whatever its faults, tried to describe what it cost a bank to borrow unsecured for months. Every benchmark reports a market, and first it picks which one.
Gold went through its own reform. For almost a century the London gold price was fixed by a small group of banks on a call, in a process dating from 1919. In May 2014 the UK regulator fined Barclays £26 million after a trader manipulated the fix on one day to avoid paying a client. From 20 March 2015 the fix was replaced by the LBMA Gold Price, an electronic auction administered by ICE Benchmark Administration, run twice a day at 10:30 am and 3 pm London time, with bids and offers from direct participants and an audit trail.

Judgement never leaves
Transactions are not the only answer, and in some places they are not an answer at all. The most famous stock index in the world, the S&P 500, is not a list of the five hundred largest American companies chosen by formula. Its members are selected by a committee at S&P Dow Jones Indices, applying published eligibility criteria and its own discretion. Trillions of dollars in index funds buy whatever that committee adds.
Closing prices, the numbers that value most funds each evening, are increasingly set in a closing auction, a single matching at the end of the day into which a large share of index-fund trading is deliberately concentrated. The rules of that auction, how imbalances are published and when orders may be cancelled, decide the number that becomes the day's official price.
What a good benchmark looks like
After LIBOR, regulators wrote down what they had learned. In July 2013 IOSCO, the international body of securities regulators, published principles for financial benchmarks, and the European Union later turned similar ideas into law in its Benchmarks Regulation. The principles are unglamorous and precise, and they read like a list of everything that went wrong.
A benchmark should be anchored in observable transactions wherever possible. Its methodology should be published, and changes to it consulted on. The administrator should manage conflicts of interest, keep records, and be subject to oversight by somebody independent of the people who make submissions. When data is thin, the benchmark should say so and explain what it does instead. And it should be designed with the possibility of its own end in mind, so that contracts which depend on it can find a replacement.
None of that guarantees a good number. It moves the question from whether the people making a number are honest to whether the process makes dishonesty difficult and visible, which is the only question a user of a benchmark can actually check.
The same problem, in new architecture
Blockchains reproduce all of this in software. A lending protocol has no way to see a price by itself. It must be told by an oracle, a system that reads venues off-chain, applies filters and weights, and writes a number on-chain that contracts then treat as fact. The oracle is an administrator, its code is a methodology, and its sources are a panel.
The failure modes are recognisable. In October 2022 a trader bought up the thinly traded token of the Mango Markets protocol on the venues its oracle read, watched the reported price multiply, and borrowed against the inflated value, leaving with roughly $110 million. He was later convicted of fraud; in 2025 a federal judge set the convictions aside. Whatever the law finally says about the trader, the oracle did what it was designed to do. It reported the price the market showed. The market it chose to read was small enough to own for a few minutes.
That is the thread through every case in this article. Nobody owns a number outright. But somebody always decides which market it listens to, and what it ignores, and whether the people who can move it are also paid by it. Reading those rules sounds like homework for specialists. It is also the only way to know what a number is actually telling you.
For nearly four decades somebody asked a question at 11 am every London morning, and the answers set the price of an enormous amount of money. Whenever a number matters, find out who is asking now.
What was left on the floor
A trading day on the New York Stock Exchange ended as paper: order slips, notes and tape swept off the floor by hand. Every price of the day had passed through someone's fingers first.
MEN SWEEPING UP THE FLOOR OF THE STOCK EXCHANGE, NEW YORK, 1908 · Library of Congress, public domain (LCCN 2013646362) · photograph, toned to the page
Outside, on Broad Street, the curb market traded in the open air. Brokers stood in the road; clerks leaned from the windows above and signalled orders down to them by hand. A price discovered in one room had to cross a street before it existed anywhere else.
BROAD STREET AND CURB BROKERS, NEW YORK CITY, 1916 · Library of Congress, public domain (LCCN 97517304) · photograph, toned to the page. How humans solved this before today's machinery: they carried the price by hand and voice, and accepted that it arrived late.
This issue argues that a price is not a fact about a thing but the temporary output of a system. It is an elegant idea. It is also, from the point of view of anybody who works in a market, a description of Tuesday.
Practitioners do not believe that price is a property of an object. They never did. A trader is taught on the first day that there is a bid and an ask and that the last trade is history. A risk manager knows the difference between a mark and a close, and why an exchange's settlement price is not its last print. An accountant has a whole standard, with three levels, for how much judgement went into a fair value. A fund administrator can tell you to the minute which benchmark fixing her NAV used. None of this is hidden. It is written down, in contract specifications, methodology documents and rulebooks, and it is read every day by the people whose job is to read it.
What this issue calls a mystery, the industry calls definitions. The word price, on its own, is informal. In any contract that matters it is replaced by a precise term that says which price, from where, at what time. When a futures contract settles at the settlement price determined by the exchange under rule so-and-so, nobody involved is confused about the nature of reality. They know exactly what number they agreed to.
There is a cost to dressing ordinary engineering as philosophy. A reader who comes away believing that prices are fundamentally arbitrary, constructed, or unknowable has learned something false. The five venues quoting bitcoin in this issue's frozen second disagreed by nine basis points, and most of that turned out to be a currency conversion. That is not evidence that price is a fiction. It is evidence of how extraordinarily well markets agree, across continents, in under a second, without anybody coordinating them.
The same goes for the famous failures. LIBOR was corrupted because it was a survey dressed as a rate, and the fix was to base rates on transactions. Oil went negative because a physically delivered contract met a physical constraint, which is exactly what the contract said could happen. The nickel cancellation happened because an exchange's rulebook gave it that power, and a court later confirmed the rulebook meant what it said. In each case the system did what its definitions specified. The lesson is to read the definitions, not to doubt the concept.
Most people, most of the time, do not need to know how the price on their screen was made, for the same reason they do not need to know how their tap water was treated. The system works because specialists maintain it and because failures are rare and loud. Telling readers that every number hides a hidden machine risks the opposite of what this magazine wants: not literacy, but a vague and fashionable suspicion of every figure, which is easy to feel and useless to act on.
It is also worth noticing how little of the confusion in markets comes from the nature of price and how much comes from people not reading what they signed. The investor who bought an oil fund in April 2020 without knowing it held front-month futures, the borrower who did not know their loan referenced LIBOR, the trader who did not know an exchange could void trades: each was failed by a gap in their own knowledge of a documented rule, not by a hidden metaphysics of value. The remedy is plain disclosure and plain reading.
A price is just the price. It is defined, it is published, and in the overwhelming majority of cases it is exactly what it says it is.
You Changed the Price
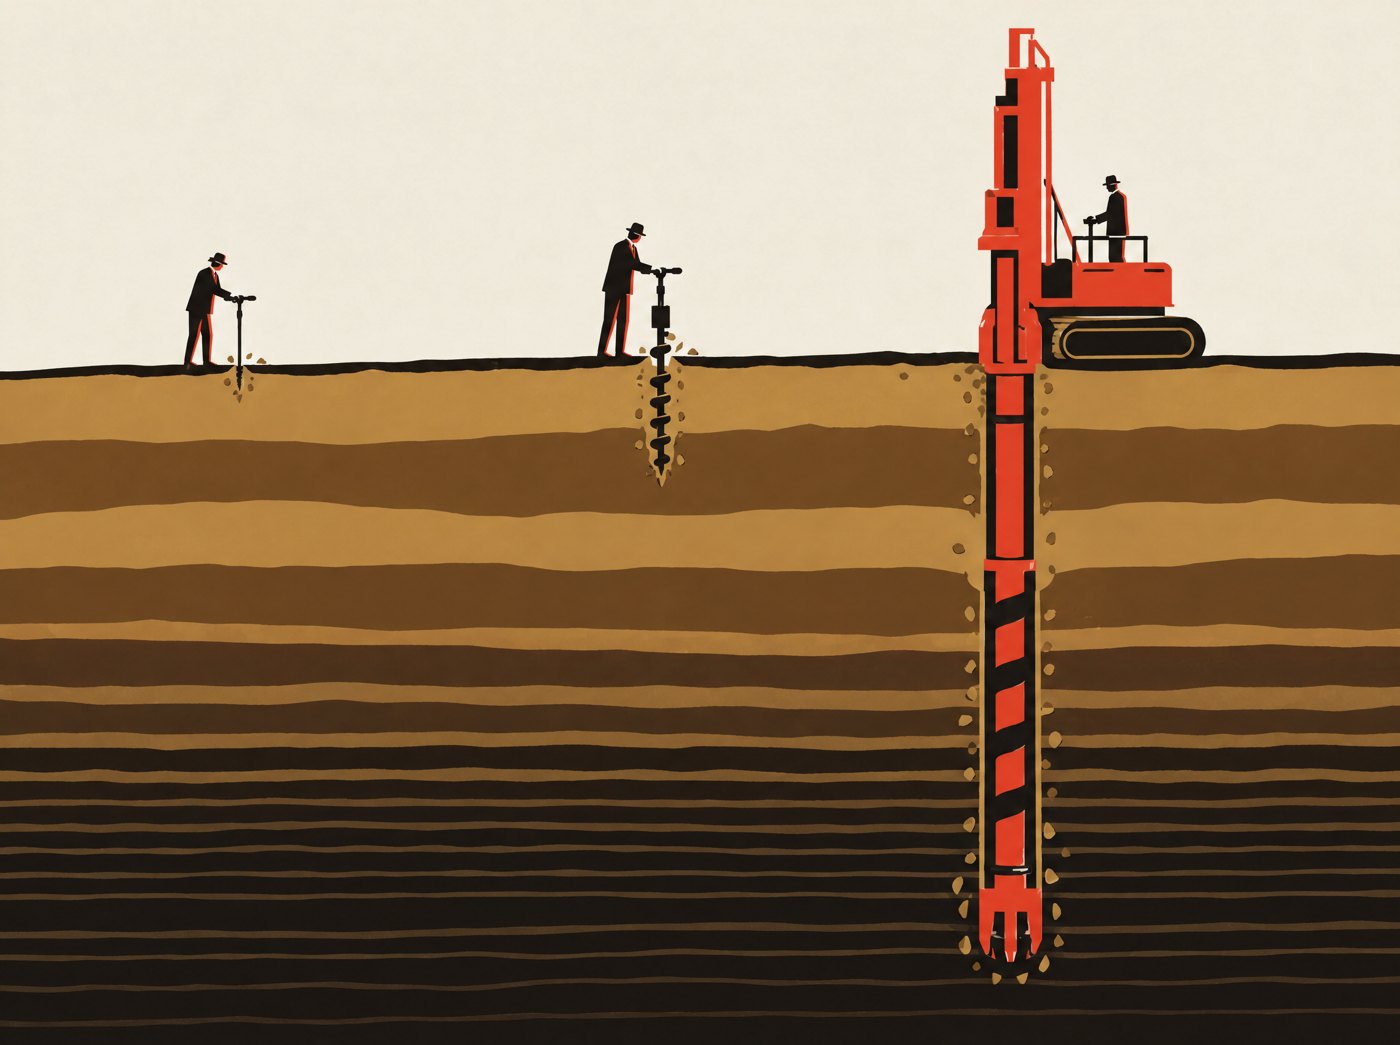
There is a price, and I decide whether to trade at it. That is how almost everyone imagines a market, including many people who trade in one. It is true for small orders. For large ones it is backwards.
The number on a screen is the price of the first unit. It tells you what the best offer is and nothing about how many units are behind it. Buy one share of a large company and you will pay the screen price. Buy a hundred thousand shares and you will pay the screen price for the first few hundred, a little more for the next few hundred, and more again after that, because your order will eat through the queue of sellers from the cheapest upward. The price you pay depends on how much you want.
Traders have words for the pieces. Depth: how much sits at each level. Slippage: the gap between the price you saw and the average you got. Impact: what your buying does to everyone after you, you included.
Liquidity: enough on the other side that none of it hurts.
A real book, measured
Here is the sell side of Binance's bitcoin book 470 milliseconds before our second, from our own capture. The best offer was $75,807.20 for 6.83704 bitcoin. Behind it, twenty price levels were visible to us, running up to $75,811.26. In total those twenty levels offered $585,236 of bitcoin.
Walk orders of different sizes up that book, as if they had arrived at that instant, and the answers are on page 40. An order for a thousand dollars, ten thousand or a hundred thousand fills entirely at the best offer. The first price on the screen was the true price for all three.
A million-dollar order does not fit. The whole visible book covers $585,236. That part would have filled at an average only 0.04 basis points above the screen, about $2 in total, which is a remarkably small toll for more than half a million dollars of bitcoin. The other $414,764 we cannot price at all, because our capture only sees twenty levels. More sellers almost certainly stood above. How many, and where, we can't say.
Half a second later the same book looked very different. At 537 milliseconds into the second, after a run of buying on every venue, the twenty visible levels on the sell side held $30,094. A hundred-thousand-dollar order, which had filled at one price a moment earlier, now could not be priced from what was visible at all.

How much does a million dollars cost?
Odd question, on purpose. Not what a million buys: what it costs to spend. The honest answer has three parts, and only the first ever reaches a screen.
The first is the visible cost: fees, and the spread you cross. On Binance at our instant the spread was one cent, so crossing it cost nothing worth measuring. Fees are published, and depend on who you are.
The second is slippage against the visible book, which is what we calculated above, and which can be tiny or large depending on the moment you arrive.
The third is what happens next. Other participants see the trades. Market makers who were offering size move their prices away, because a large buyer is information. Some pull their offers entirely. The staircase moves when you step on it, so large orders are almost never sent at once. They are cut into small pieces and released over minutes or hours by algorithms with names like VWAP and TWAP, which try to buy at the average price of the period without announcing that a big buyer is present.
Slicing costs too: while you wait, the price wanders for its own reasons. Every execution desk trades moving the
| Order | Book at | Cost over the screen | Levels used |
|---|---|---|---|
| $1,000 | −470 ms | 0.00 bp | 1 level |
| +537 ms | 0.00 bp | 1 level | |
| $10,000 | −470 ms | 0.00 bp | 1 level |
| +537 ms | 0.00 bp | 1 level | |
| $100,000 | −470 ms | 0.00 bp | 1 level |
| +537 ms | $30,094 priced | $69,906 beyond the visible book | |
| $1,000,000 | −470 ms | $585,236 priced | $414,764 beyond the visible book |
| +537 ms | $30,094 priced | $969,906 beyond the visible book | |
| $10,000,000 | −470 ms | $585,236 priced | $9,414,764 beyond the visible book |
| +537 ms | $30,094 priced | $9,969,906 beyond the visible book |
market against waiting for it, and the screen shows neither.
The queue
Each step of the staircase is also a queue. Most exchanges fill resting orders at the same price in the order they arrived, which traders call price-time priority. A seller who joined the best offer early is filled first; one who joined later waits, and may not be filled at all before the price moves away.
That makes the book a strange kind of object. The 6.83704 bitcoin offered at $75,807.20 in our snapshot was not one seller's offer. It was a line of them, and the position of each in the line was worth something. Firms pay heavily for the speed to reach the front. The front is filled by traders crossing the spread; the back is filled mostly just before the price turns against it.
The same arithmetic, selling
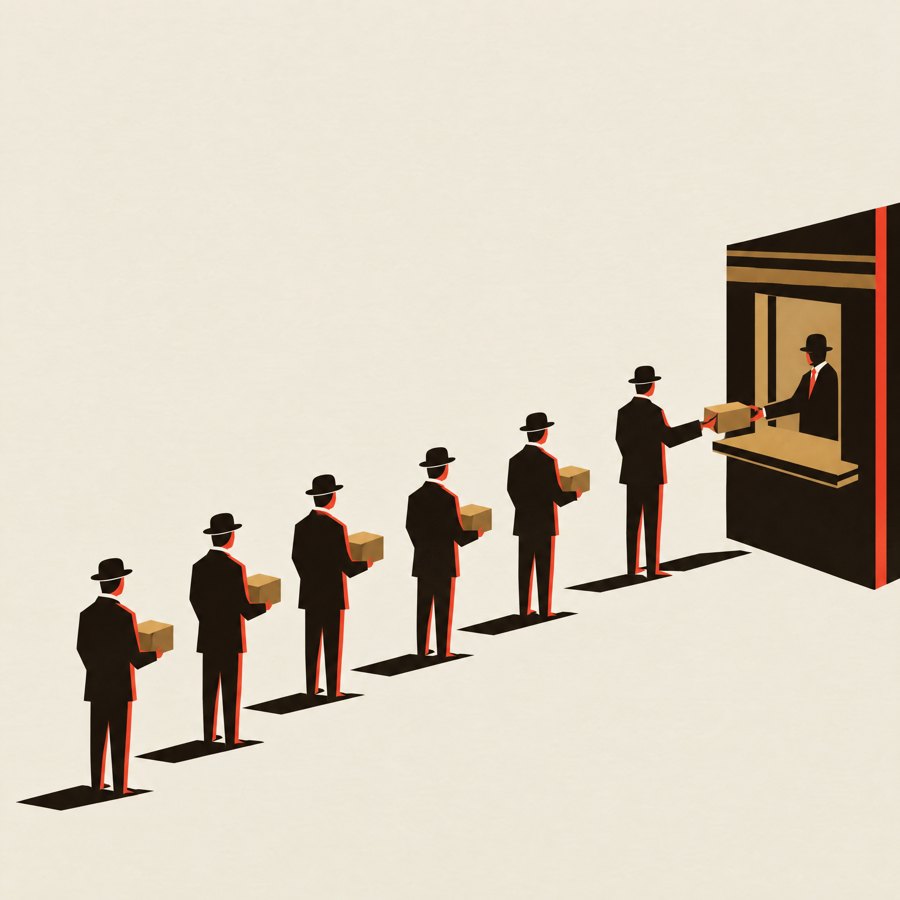
Everything above applies in reverse to a seller, with one asymmetry that matters in bad weeks. When a large holder must sell, because of a margin call or a redemption, the buyers in the book know that the selling has to happen. They have no reason to stand in its way. Bids thin out, and the seller walks further down the book than a buyer of the same size would have walked up it. Forced sellers pay for being forced, and the price they get is one they helped to make.
So the value of a portfolio on a screen, quantity times last price, is money no large holder could actually receive. It assumes selling one unit at a time into a market that never notices. Close enough for a small investor. For a fund that owns a real share of what it holds, the gap is one of its largest risks, and the screen never shows it.
The part you cannot see
Order books also contain orders that do not show. Many venues allow iceberg orders, which display a small visible size and replenish from a hidden reserve as they fill. Some trading happens away from public books entirely, in dark pools and through dealers quoting privately. A visible book is a lower bound on liquidity, and on a bad day it is an optimistic one, because the orders it shows can be cancelled faster than a human can click.
So a large buyer is really asking what the price will be after they have finished. That number does not exist yet, and their own order is one of the things that will decide it.
The next four pages show one real order that was large enough to test the book, and what the book did around it.
Somebody Placed the Order
- QUESTION
- What does one large order do to a book, and what does it cost the person who sends it?
- METHOD
- We did not place an order. The largest print in our frozen second was placed by somebody else, and we reconstructed it from our own capture: the book before, the print, the book after.
- DATE
- 16 Sep 2026 · 07:24:03.530 to 07:24:04.537 UTC · Binance BTC/USDT
- SAMPLE
- One aggregated print, two depth-20 snapshots, 207 Binance prints in the window.
- LIMITS
- We cannot see who sent it, why, or what fee tier they pay. Binance's aggregated trade stream combines fills of one taker order at one price, so one print may be several fills.
- RESULT
- It paid the screen price. The book around it did not survive the second.
Binance, 470 ms before the second. Best offer $75,807.20 for 6.83704 BTC, worth $518,297. Twenty visible levels on the sell side, $585,236 in all. First eight:
| Price | BTC offered | Worth |
|---|---|---|
| 75,807.20 | 6.83704 | $518,297 |
| 75,807.21 | 0.00098 | $74 |
| 75,807.22 | 0.00014 | $11 |
| 75,808.10 | 0.00200 | $152 |
| 75,808.41 | 0.00014 | $11 |
| 75,808.42 | 0.01764 | $1,337 |
| 75,808.61 | 0.00007 | $5 |
| 75,808.80 | 0.00741 | $562 |
An order to buy. We infer the side: it crossed at the best offer, not the best bid. We cannot see whether it was a market order or a limit order priced to take, or whether it was one slice of something larger.
At +67 ms into the second, one aggregated print: 6.51994 BTC at $75,807.20, worth $494,258. The largest single print on any of the five venues in the second.
It fitted inside the best offer shown in the previous snapshot, 6.83704 BTC at that price, so every unit paid the screen price. The level was not exhausted by this print alone: 0.31710 BTC would have remained.
Slippage against the price on the screen: 0.00 bp.
Fees: unknown. Binance publishes a spot taker fee schedule that starts at 0.10% and falls with volume and holdings. At the base rate this order would have paid about $494; a large firm would pay less. We do not know this firm's tier.
Market impact: see 05.
Between the snapshot before and the snapshot at +537 ms, the best offer rose $36.81, about 4.9 bp. The dollars visible on the sell side fell from $585,236 to $30,094, a drop of 95%.
In that window Binance printed 207 trades for 16.33 BTC, $1,237,816. So our order was about 40% of the bitcoin bought there in half a second, and the rest came after it, while Bybit, OKX and Gate were printing higher too.
| Book at | Best bid | Best ask | Visible sell side | 20th ask level |
|---|---|---|---|---|
| −470 ms | 75,807.19 | 75,807.20 | $585,236 | 75,811.26 |
| +537 ms | 75,844.00 | 75,844.01 | $30,094 | 75,848.89 |
| +1,597 ms | 75,840.33 | 75,840.34 | $638,838 | 75,846.05 |
How much of the thinning was this order, how much was the buying that followed it, and how much was market makers pulling their offers because they saw the buying. A book snapshot shows what is there, not why it left.
One second later the sell side had been rebuilt, deeper than before, about $33 higher.
Who the buyer was. Who the sellers were: several makers may have been resting at that price. Whether the order was the first slice of a larger one. What the buyer paid in fees. Whether anything was hidden behind the visible levels.
The screen price was honest for this order and useless as a description of the market a few hundred milliseconds later. A buyer of the same size arriving at +537 ms would have found less than a tenth of the dollars visible, and could not have filled from the visible book at all.
An order we sent would have been small enough to learn nothing, or large enough to become a story about us. The market had already run the experiment, with a real buyer and real money, inside the second we froze before writing a word. We report it exactly as captured.

One Thing. Many Prices.
Gold is gold. An ounce of it is 31.1035 grams of the same element wherever it is. And yet on any given morning there are a dozen prices for an ounce of gold, all of them published, all of them correct, and no two quite the same.
There is the London price, for metal held in the vaults of the London bullion market. There is the price of a gold future in New York, for a hundred ounces delivered to an approved depository in a named month. There is the price of a share in a gold fund, a coin at a dealer, a token on a blockchain, and gold in Shanghai, quoted in yuan per gram. The natural reaction is to see arbitrage everywhere: surely somebody should buy the cheap one and sell the dear one until they meet.
Sometimes somebody does. Mostly they were never meant to meet. The metal is the same; the contract around it differs, and a price is always the price of a contract.
Two tokens, one ounce each
Consider two tokens that each represent one fine troy ounce of gold. PAX Gold is issued by Paxos, which says each token is backed by an ounce of London Good Delivery gold in allocated storage. Tether Gold is issued by TG Commodities, a company related to Tether, which says each token is backed by an ounce held in a Swiss vault. When we checked both, in the same update of the same price service, they were several dollars apart. The figures are on page 50, marked as another second: we measured them hours after this issue's frozen second, and gold tokens are not in our own capture.
Same metal, same weight, a few dollars apart. Neither number is wrong. One token is a claim on a company regulated in New York holding gold in London. The other is a claim on a different company holding gold in Switzerland. The difference in price is the market's view of the difference in those claims, plus the difference in who trades each token and where.
What you are actually buying
Every instrument that gives you gold exposure also gives you some other things, and each of those things has a price. Page 49 sets them out. Time is one: a future for delivery in December is priced above gold today by roughly the cost of financing and storing the metal until then, which is why futures in normal markets trade above spot. Location is another: gold in a London vault is worth more to a jeweller in Mumbai than gold that must be flown there, refined into another bar size and cleared through customs.
Custody matters. Unallocated gold in a London account is a claim against the bank that holds it; if the bank fails, you are a creditor. Allocated gold is specific numbered bars that are yours. Credit matters for the same reason, and so does liquidity: the most traded instrument usually has the tightest spread, and people pay for the ability to get out quickly.
Settlement matters. Spot gold in London settles two business days after the trade. A token settles in minutes on a blockchain but may take days to redeem for metal, subject to minimum sizes. A fund share settles like a share. And some instruments carry options. A holder of a futures contract can choose to take delivery, and a large enough token holder can choose to redeem; smaller holders cannot, and that missing choice is part of what they are paying for.
The fund that slowly owns less
When SPDR Gold Shares launched in 2004, each share represented one tenth of an ounce. The fund charges a yearly fee of 0.40%, and it pays that fee by selling a little gold. So each year every share represents slightly less metal than the year before. The difference is small in any one year and not small over twenty. A share of the fund and a tenth of an ounce of gold were the same thing on the first day and have been drifting apart ever since, precisely as the prospectus says they will.

| Instrument | What you hold | Its price |
|---|---|---|
| London spot (loco London) | Unallocated or allocated metal in London vaults, T+2 | LBMA Gold Price, 10:30 and 15:00 |
| COMEX gold future | 100 troy oz, delivery to approved depositories in a set month | Exchange settlement price |
| SPDR Gold Shares | Fund share backed by allocated London bars, 0.40% a year paid in gold | NAV at the LBMA Gold Price PM |
| One-ounce bullion coin | Minted coin, dealer buys back below sale price | Dealer quote over spot |
| PAX Gold | Token for one fine troy oz of London Good Delivery gold, Paxos | $4,355.79 at 15:49 UTC |
| Tether Gold | Token for one troy oz in a Swiss vault, TG Commodities | $4,351.16 at 15:49 UTC |
| Shanghai Gold Exchange | Yuan per gram, onshore, import-controlled | Can sit at a premium to London |
Gold with a passport
Location can become a price on its own. The Shanghai Gold Exchange quotes gold in yuan, and China controls how much gold can be imported. When domestic demand runs hot and imports cannot keep up, Shanghai gold trades at a premium to London converted at the exchange rate, sometimes a large one. No arbitrageur will erase it by lunch. It is the price of the border.
Coins at a dealer sit at the other end. A one-ounce bullion coin sells above the value of its metal, because somebody had to mint it, ship it, insure it and hold it in a shop, and because a dealer buys it back from you below the price they sell it at. Small buyers pay for smallness.

Time has a price in gold too
The difference between a gold future and gold today is usually small and positive, and it has a name: the cost of carry. Somebody who buys metal now and sells a future against it must finance the purchase and pay for storage and insurance until delivery. The future is priced so that doing so earns roughly nothing extra. When interest rates rise, the gap between spot and futures widens, because carrying the metal costs more. When it inverts and futures trade below spot, somebody is paying a great deal to have gold now rather than later, which is itself a piece of news.
A token has its own version. PAX Gold and Tether Gold can trade continuously, including at weekends when the London market is shut, so for two days a week their prices are among the few live gold prices in the world. They are also, during those hours, prices with no market in the metal behind them to arbitrage against. Their weekend prices are a view about Monday.
Not every gap is free money
None of this means the prices of related instruments drift wherever they like. The links are real and they are enforced by people who make their living from them. If a gold fund trades far enough above the value of its metal, authorised participants create new shares by delivering gold and sell them. If a future trades too far above spot plus the cost of carry, someone buys the metal, sells the future and delivers. The gaps close to roughly the cost of doing that, and no further.
That residual gap is the most informative number of all. It is the price, set by a market, of the specific rights and frictions that separate one kind of ounce from another.
An ounce is an ounce. The contracts around it never are, and the price tells you so, if you read what it is the price of.
The Day the Market Cancelled Itself
A trade is the most solid thing a market produces. Two parties agreed, a price was printed, a clearing house stood in the middle. On the morning of 8 March 2022 the London Metal Exchange decided that about eight hours of those trades had not happened.
The contract was three-month nickel, the LME's benchmark for a metal that goes into stainless steel and batteries. The chronology below comes from the exchange's own notices, a working paper by the US Office of Financial Research, the High Court judgment that followed, and the UK Financial Conduct Authority's final notice.
The run-up
Russia's invasion of Ukraine on 24 February raised fears about supply from one of the world's largest nickel producers. At the same time, the Tsingshan Holding Group, a large Chinese stainless steel and nickel producer, held a very large short position, reported at between 100,000 and 300,000 tonnes, much of it off the exchange through banks. Shorts lose money when prices rise, and must post margin as they do.
According to the OFR paper, three-month nickel rose from about $27,000 a tonne to $29,100 on Friday 4 March, and to $50,300 at Monday 7 March's close. The LME's own review later described the move on 7 March as nearly five times the next largest move in nickel in twenty years. Margin calls on the shorts ran into billions of dollars.
The morning
The LME opens at 1:00 am London time for Asian trading hours. In the early hours of Tuesday 8 March the price roughly doubled again, to above $100,000 a tonne, as holders of short positions bought to close them and others sold into the move. At 6:16 am LME Clear agreed to freeze margin requirements at the previous close. At 8:15 am the exchange suspended nickel trading.
Around midday it announced that it would cancel all nickel trades executed on 8 March before the suspension. Estimates of what was voided range from about 5,000 to 9,000 trades, and from $3.9 billion to $12 billion in value. The price reverted to the 7 March close. Trading did not resume until 16 March, with
| 24 Feb | Russia invades Ukraine. |
| 4 Mar | $29,100 close. LME Clear raises nickel initial margin 12.5%. |
| 7 Mar | $50,300 close. Record intraday margin calls. |
| 8 Mar 01:00 | Asian session opens. |
| 8 Mar, early | Price doubles to above $100,000. |
| 06:16 | LME Clear freezes margin at the 7 Mar close. |
| 08:15 | Nickel trading suspended. |
| ~12:00 | All 8 Mar trades before suspension cancelled. |
| 16 Mar | Trading resumes with daily price limits. |
| Nov 2023 | High Court dismisses Elliott and Jane Street claims. |
| Mar 2025 | FCA fines LME £9,245,900. |
new daily limits on how far the price could move.

The reasoning
The exchange's argument was that the market had become disorderly, that prices no longer reflected underlying supply and demand, and that at those prices several clearing members could default, threatening the clearing house itself. The OFR paper describes LME Clear's own analysis that morning of an intraday margin call that would have run to tens of billions of dollars.
Cancelling the trades removed the losses that would have caused those defaults. It also removed the profits of everybody on the other side. Firms that had sold nickel at elevated prices that morning, including the hedge fund Elliott and the trading firm Jane Street, lost trades that would have been profitable, and challenged the decision in court. In November 2023 the High Court dismissed their claims, finding that the exchange had acted within its powers.
In March 2025 the FCA fined the LME £9,245,900 for failing to maintain orderly trading during that period, the first penalty it had imposed on a recognised investment exchange. Its notice concerned the exchange's systems and controls in the days before the suspension, rather than the decision to cancel.
What changed afterwards
The LME introduced daily limits on how far prices of its main contracts could move, began collecting more information about over-the-counter positions linked to its prices, and asked its clearing members to hold more data about their clients' exposures. All of it aimed at what the episode exposed: a huge position, mostly off the exchange, invisible to it until it moved the price.
The question
Taking a side on the LME is easy. The harder question is what the episode says about a price. For eight hours on 8 March, nickel traded above $80,000 and briefly above $100,000. People watched those numbers, made decisions on them, and some physical contracts around the world are indexed to LME prices. Then the official record was rewritten to say the price that day had been, in effect, what it was the night before.
The trades happened. The prices were printed. The exchange's rules gave it the right to decide that they did not count, and a court agreed the rules meant it. So a completed trade is solid, but conditional. Its authority rests on a rulebook, and in the last resort on the judgement of whoever runs the market about whether the market was still a market.
The chart of nickel for March 2022 in the official history has a gap in it. Page 53 shows what was in the gap.
| ms | venue | bid | ask | spread |
|---|---|---|---|---|
| +0 | bybit | 75,809.8 | 75,809.9 | 0.10 |
| +55 | bybit | 75,827.8 | 75,840.6 | 12.80 |
| +263 | bybit | 75,849.0 | 75,849.1 | 0.10 |

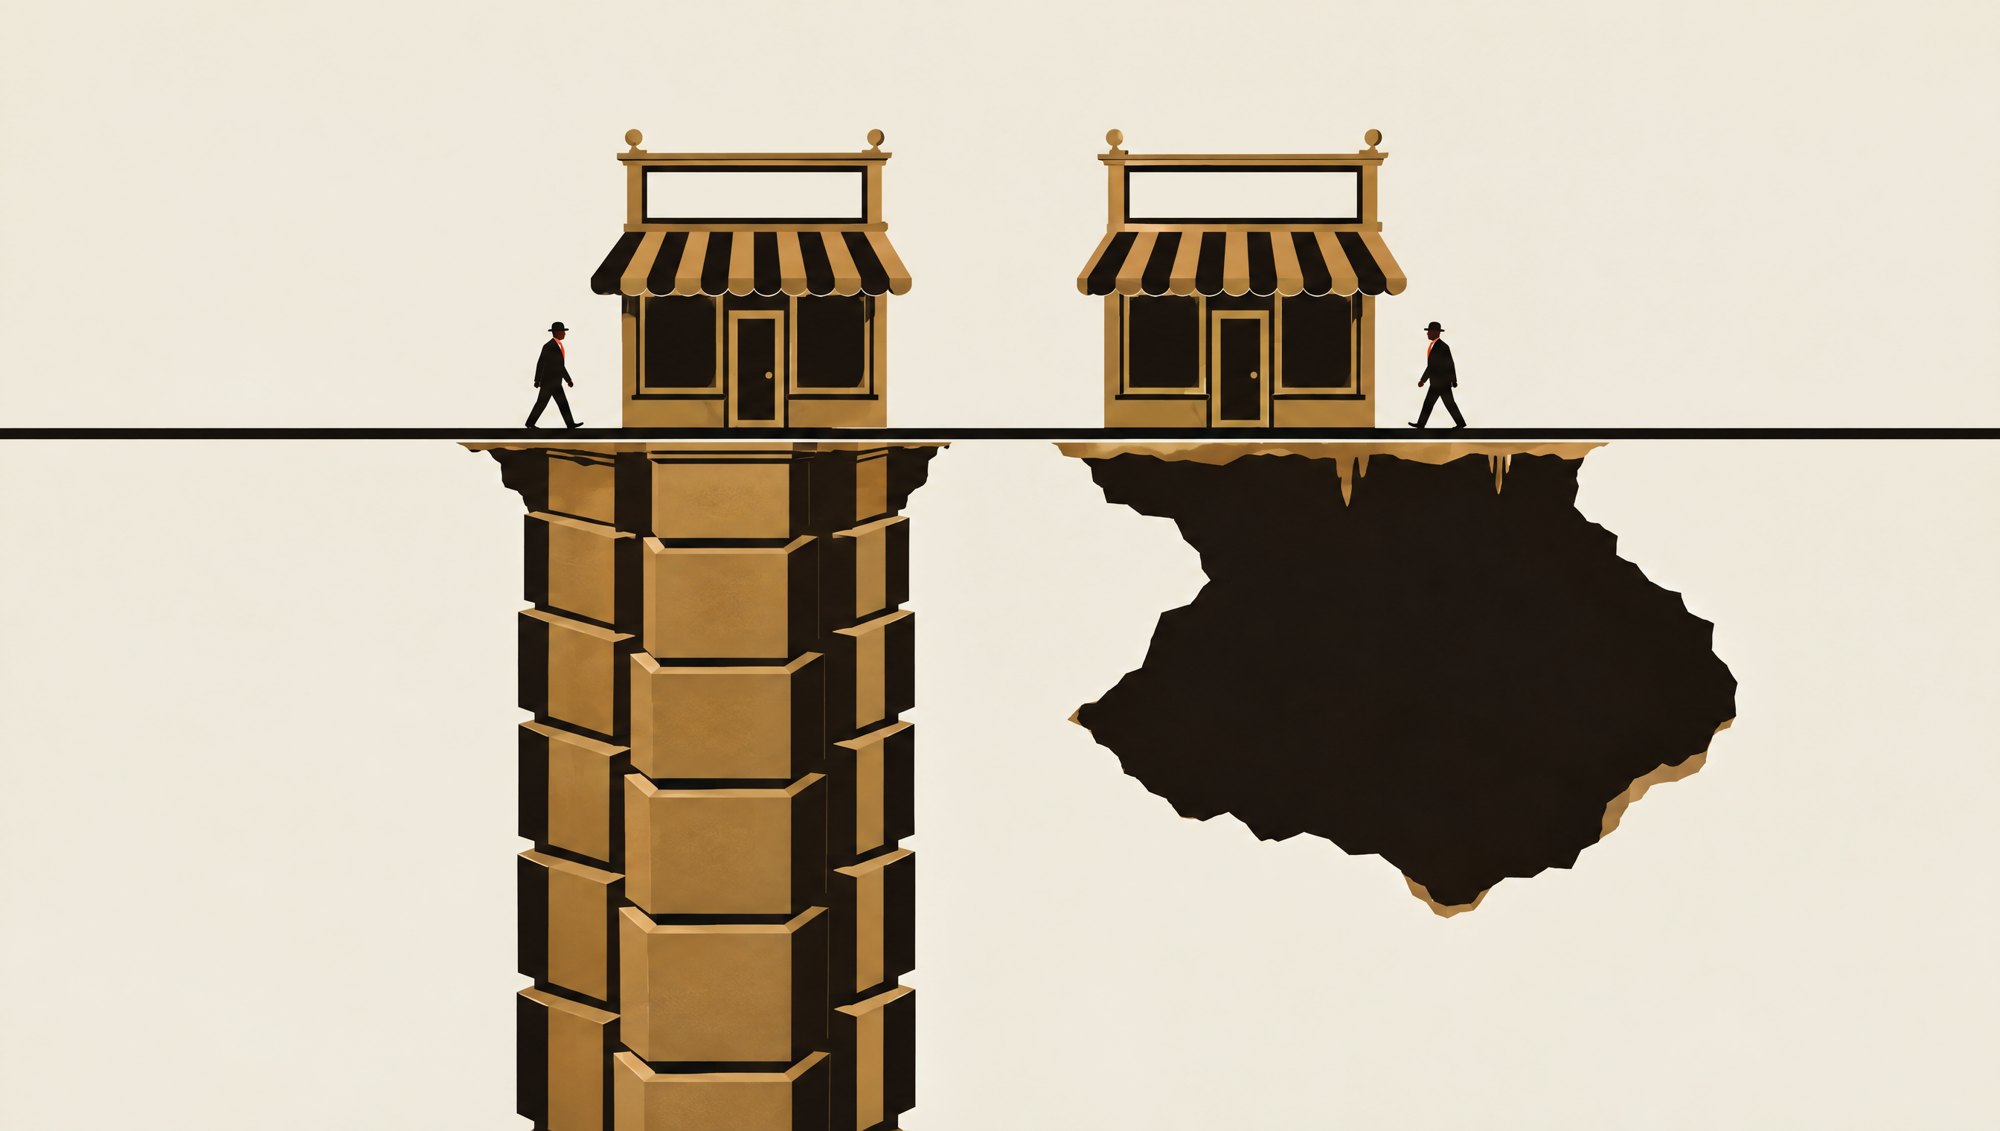
Liquidity Is Invisible Until It Isn't
Two screens show the same price. One market can absorb a large order without flinching. The other would move several per cent. Nothing on either screen tells you which is which.
That is the difficulty with liquidity. It is the most important property of a market for anybody who trades size, and it has no ticker symbol. It lives below the displayed quote, in how much is offered at each price behind the best one, how quickly those offers come back after they are taken, and how many of them are real. Most of the time it is invisible because it is plentiful. It becomes visible at the moment it disappears.
Same price, different market
Our own capture contains a clean example, one second apart on the same venue. At 537 milliseconds into our second, Binance's best offer for bitcoin was $75,844.01. At 1,597 milliseconds, just after the second ended, it was $75,840.34. The two prices are $3.67 apart, half a basis point, close
enough that nobody glancing at a screen would notice any change.
The markets underneath were not close. At +537 ms the twenty visible levels on the sell side held $30,094. At +1,597 ms they held $638,838, about 21 times as much.
Send the same order into both. A $25,000 purchase against the first book would have used 14 of the twenty levels and paid 0.11 bp over the screen. Against the second book it would have filled at the best offer. A $250,000 purchase could not have been priced at all from the first book, and would have cost next to nothing against the second. Same price. Different market.
Where it went
The thin book had a cause. It sat in the middle of a burst of buying that ran across all five venues, after the large order on page 44. Market makers who had been offering size either sold it or moved away. Within about a second they were back, at slightly higher prices, deeper than before. On a calm day that cycle happens constantly and nobody sees it, because the price barely moves.
Spreads tell a similar story. At the start of the second, the gap between best bid and best ask was a cent on Binance and Coinbase and ten cents on Bybit, Gate and OKX. By the end of the second the gap on Coinbase was $9.37 and on Gate $3.60. On the other three it had not moved. Nobody announced it. On two venues the people willing to act stepped back, and the price stayed on the screen as though nothing had happened.

When it goes all at once
Those were small, ordinary withdrawals, repaired within a second. Larger ones are the moments market history remembers. On 6 May 2010 US equity markets fell and recovered within about half an hour, and some shares traded at a cent or at $100,000 as market makers' placeholder quotes, known as stub quotes, suddenly became the only orders left in the book. On 15 January 2015, when the Swiss National Bank stopped holding the franc below 1.20 per euro, liquidity in one of the world's most traded currency pairs vanished for minutes and prices gapped by double digits in percentage terms.
In each case the displayed price before the event said nothing about what was about to happen, because a displayed price describes the best offer and says nothing about the ones behind it. Depth that has been there every day for years promises nothing. The orders that make it up are free to cancel, and they cancel together, because the people who place them are reacting to the same information at the same time.
Why the makers leave together
It is tempting to see the withdrawal of market makers in a fast market as desertion. From the inside it looks like arithmetic. A market maker earns the spread on trades with people who have no special information, and loses on trades with people who know something she does not. In calm markets the first kind dominates. When prices start moving fast, a larger share of the orders arriving are from people reacting to news she has not yet seen. Every quote she leaves in the book becomes an option she has given away for free.
So she widens her spread, reduces her size, or leaves. So does every other maker running a similar model on similar data, at the same moment. No single maker ever promised the liquidity that had been there for years. It was the sum of many separate decisions to stay, and the same signal reverses all of them.
That is also why it comes back. The first makers to return to a thin book are paid well, in wide spreads, for taking the risk. Within our frozen second, the Binance book went from thin to deeper than it had started in about one second. On the days market history remembers, the same process took minutes, and in a few cases exchanges had to stop trading to give it time.
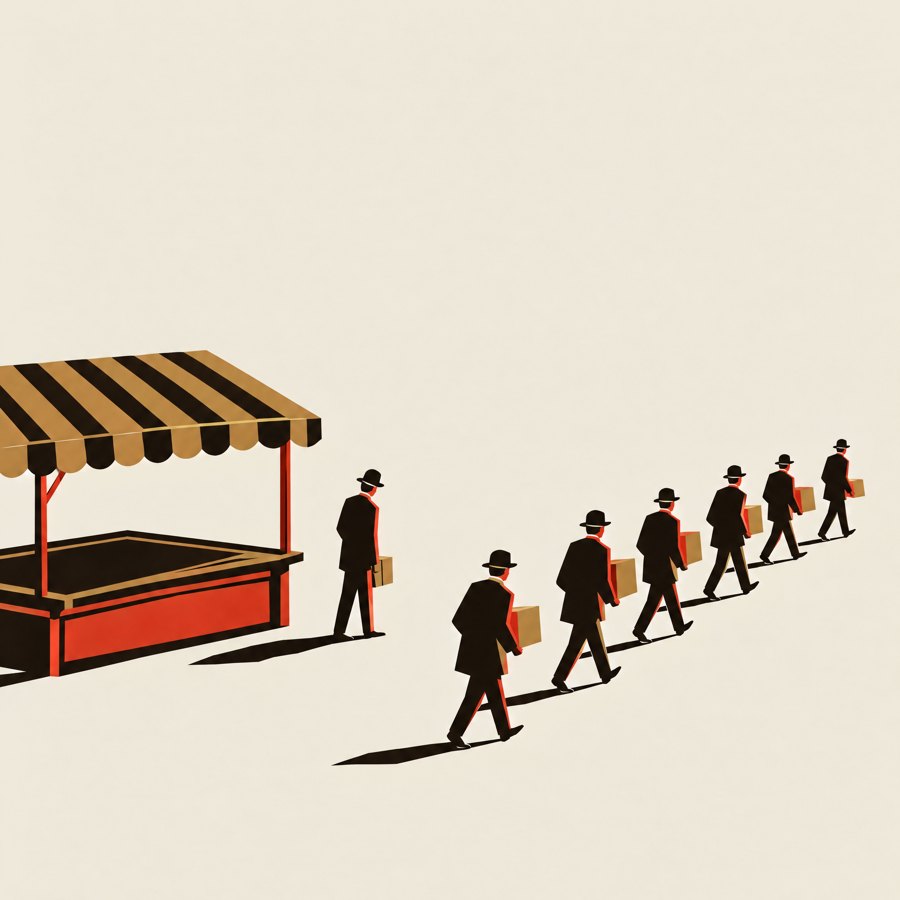
Reading what cannot be seen
Professional traders therefore watch things the price does not show: how much is offered within a few basis points of the best price, how that changes through the day, how quickly the book refills after it is hit, how wide spreads are relative to their normal range. None of them is a forecast. Each is a way of asking the market how much weight its current price could bear.
They also know that the most dangerous moment is not a thin book but a thick one that nobody has tested. Page 42 shows Binance's visible sell side over the minute around our second. Three seconds before it, more than a million and a half dollars was on offer. Inside the second, thirty thousand. Nothing about the displayed price warned of either number.
Same number, one second apart. Behind the second one stood many times the money, and the screen never said a word about it.
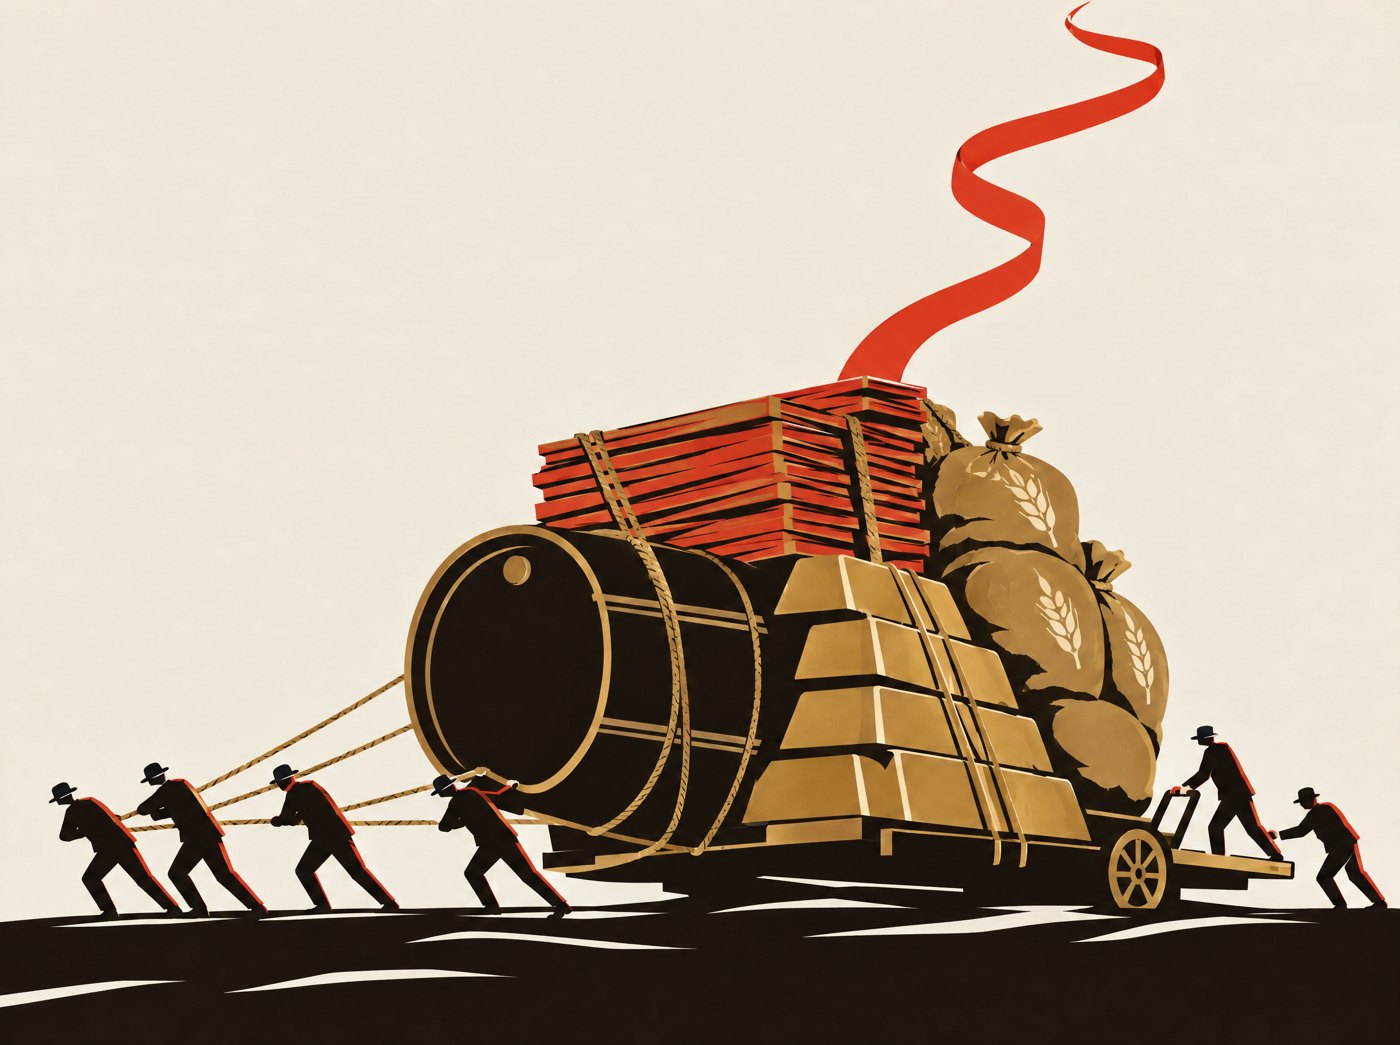
The Price Has a Body
Before it became a ticker, it was heavy. Every commodity price on a screen is the price of something that had to be dug up, pumped out or grown, then moved, stored, insured, financed and checked against a written specification before anyone would accept it in settlement of a contract.
The first two acts of this issue stayed inside the terminal. That is where most people meet prices, and where it is easy to forget that a futures contract for crude oil or copper is, at the end of the chain, a promise about a lorry, a pipeline or a warehouse. This act leaves the terminal.
What the contract describes
Open the rulebook for a commodity future and the first thing you meet is a description of an object. The price comes later. The New York Mercantile Exchange's light sweet crude contract is for 1,000 US barrels, 42,000 gallons, of oil within a range of density and sulphur content, delivered at Cushing, Oklahoma. The Chicago Board of
| Object | Unit | Mass | Specification |
|---|---|---|---|
| Crude oil WTI, NYMEX | 1 barrel = 42 US gal = 158.987 L | 130 to 134 kg per barrel | Contract: 1,000 barrels at Cushing, API gravity 37 to 42 |
| Copper Grade A cathode, LME | one lot = 25 tonnes | 25,000 kg per contract | Registered brands only, in an LME-approved warehouse |
| Gold London Good Delivery bar | 350 to 430 fine troy oz | 10.9 to 13.4 kg of fine gold | Fineness at least 995.0, accredited refiner |
| Wheat CBOT, soft red winter and others | one contract = 5,000 bushels at 60 lb | 136.08 tonnes per contract | Delivered by shipping certificate at approved elevators |
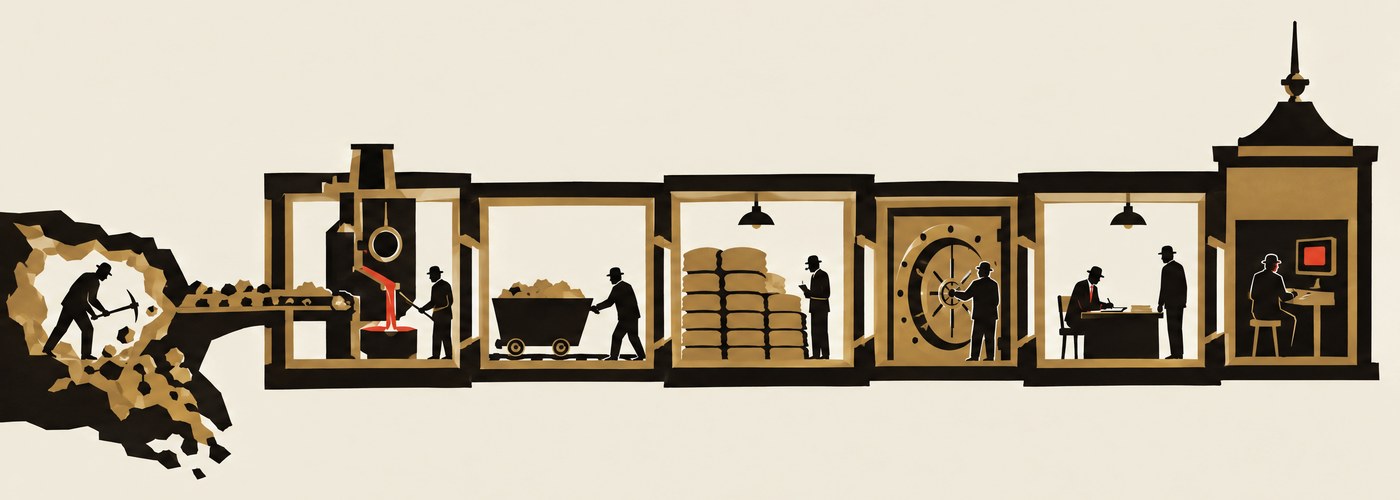 GroundProcessingTransportWarehouseFinancingContractTerminal
Trade's wheat contract is for 5,000 bushels of named grades, delivered by shipping certificate at approved elevators. The London Metal Exchange's copper contract is for 25 tonnes of Grade A cathode, from registered brands, in an LME-approved warehouse. A London Good Delivery gold bar must contain between 350 and 430 fine troy ounces at a fineness of at least 995 parts per thousand, from an accredited refiner.
Each of those details narrows what the price is the price of. Oil that is too heavy, copper from an unregistered smelter, or gold from a refiner that has lost its accreditation is still a physical object of real value. It is not deliverable against the contract, and it trades at a different number.
What gets added on the way
Follow a barrel from a well in west Texas. Somebody paid to drill and to lift it. A pipeline company charges a tariff to carry it to a hub. At Cushing a terminal charges to hold it in a tank, by the month. Somebody owns the oil while it sits there, and has paid for it with money that has a cost, so storage carries a financing charge as well. It is insured. When it moves on to a refinery, it is measured, sampled and tested, and if it is off specification the price is adjusted.
A price quoted on a screen for delivery at a hub already contains most of those costs, and the differences between hubs are largely the costs of moving between them. The spread between oil in Cushing and oil on the Gulf Coast is, much of the time, a price for pipeline capacity. The difference between copper in a Rotterdam warehouse and copper in Shanghai is a price for freight, duties and time. The ticker shows one number. The body of the commodity shows where the number came from.
When the body pushes back
Most of the time these costs are small and stable relative to the commodity, and the financial price and the physical price move together. Occasionally the body asserts itself. April 2020, on page 23, was one case: storage ran short and the price of taking delivery went below zero. Copper has had the opposite problem. When warehouse inventories on an exchange fall very low, shorts who must deliver metal compete for what little remains, and the nearest contract can trade far above later ones.
Gold hides its body better than most. It is so dense that a year of global mine production, about 3,600 tonnes, would fit in a cube a little under six metres on each side, and it is rarely consumed, so almost all the gold ever mined still exists. Yet when demand for gold in New York surged relative to London at points in recent years, bars had to be flown across the Atlantic and melted into the kilobar sizes the New York contract preferred, and for a while the price gap between the two cities reflected the capacity of refineries and cargo holds.
Two oils, one word
The world has two main benchmark prices for crude, and the difference between them is almost entirely physical. West Texas Intermediate is delivered at Cushing, in the
middle of a continent. Its price reflects what it costs to get oil to and from a landlocked hub, and when pipelines out of Cushing are full, WTI can trade at a wide discount to oil elsewhere. Brent, the benchmark for most of the world's seaborne crude, is based on cargoes loaded from terminals in the North Sea, and its price reflects oil that is already next to a ship.
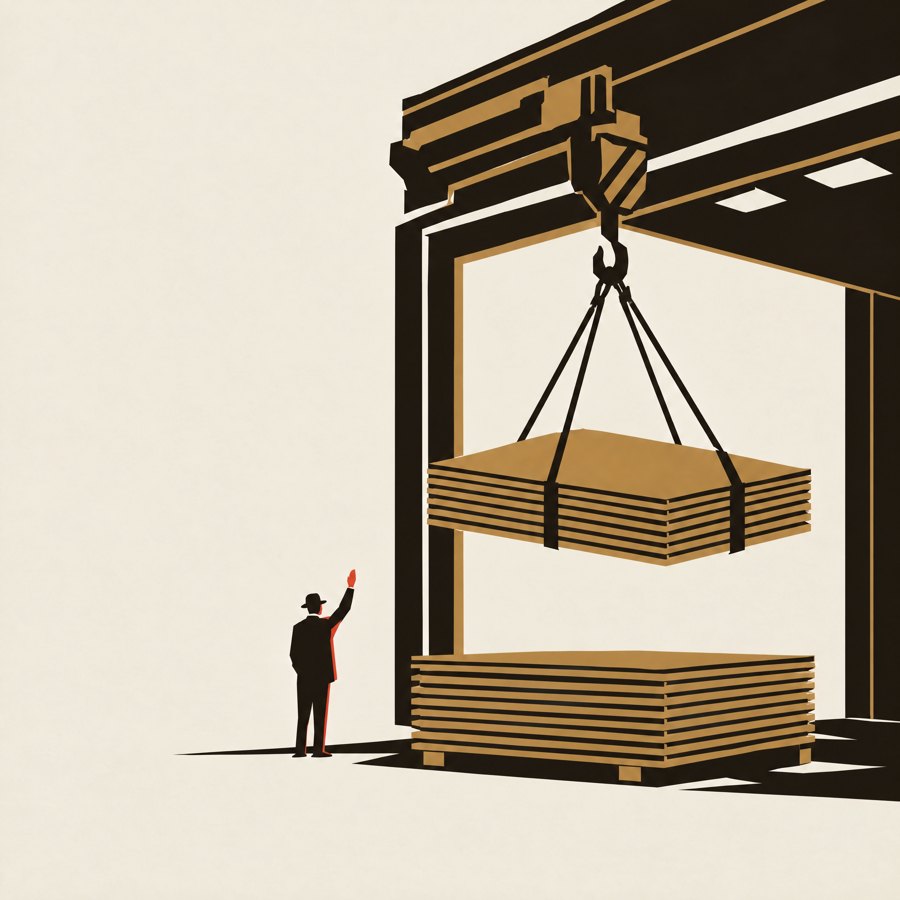
The two are similar in quality and are often both called the oil price. The gap between them has moved from a premium for WTI to a discount of more than twenty dollars a barrel and most of the way back over the past two decades, as American production grew faster than the pipelines built to carry it, and then the pipelines caught up. Nothing about the oil changed. The plumbing did.
Specification does the same work more quietly. Heavier crude and crude with more sulphur is harder to refine, so it trades below the benchmarks by an amount that depends on how many refineries can handle it. When one large refinery that runs heavy sour oil shuts for maintenance, the discount on that grade can widen for weeks. On a screen it looks like the price of oil moved. In a tank it was the price of one kind of oil.
The paper and the metal
Most futures contracts never end in delivery. They are closed before expiry, and the physical system is only there as a backstop that keeps the paper honest. But the backstop is the reason the paper means anything. A contract that could never be delivered against would be a bet on a number. A contract that can be delivered against is anchored, by the threat of delivery, to warehouses, tanks and ships.

The ticker is the lightest thing in the chain. It is also the last thing to find out when the chain breaks.
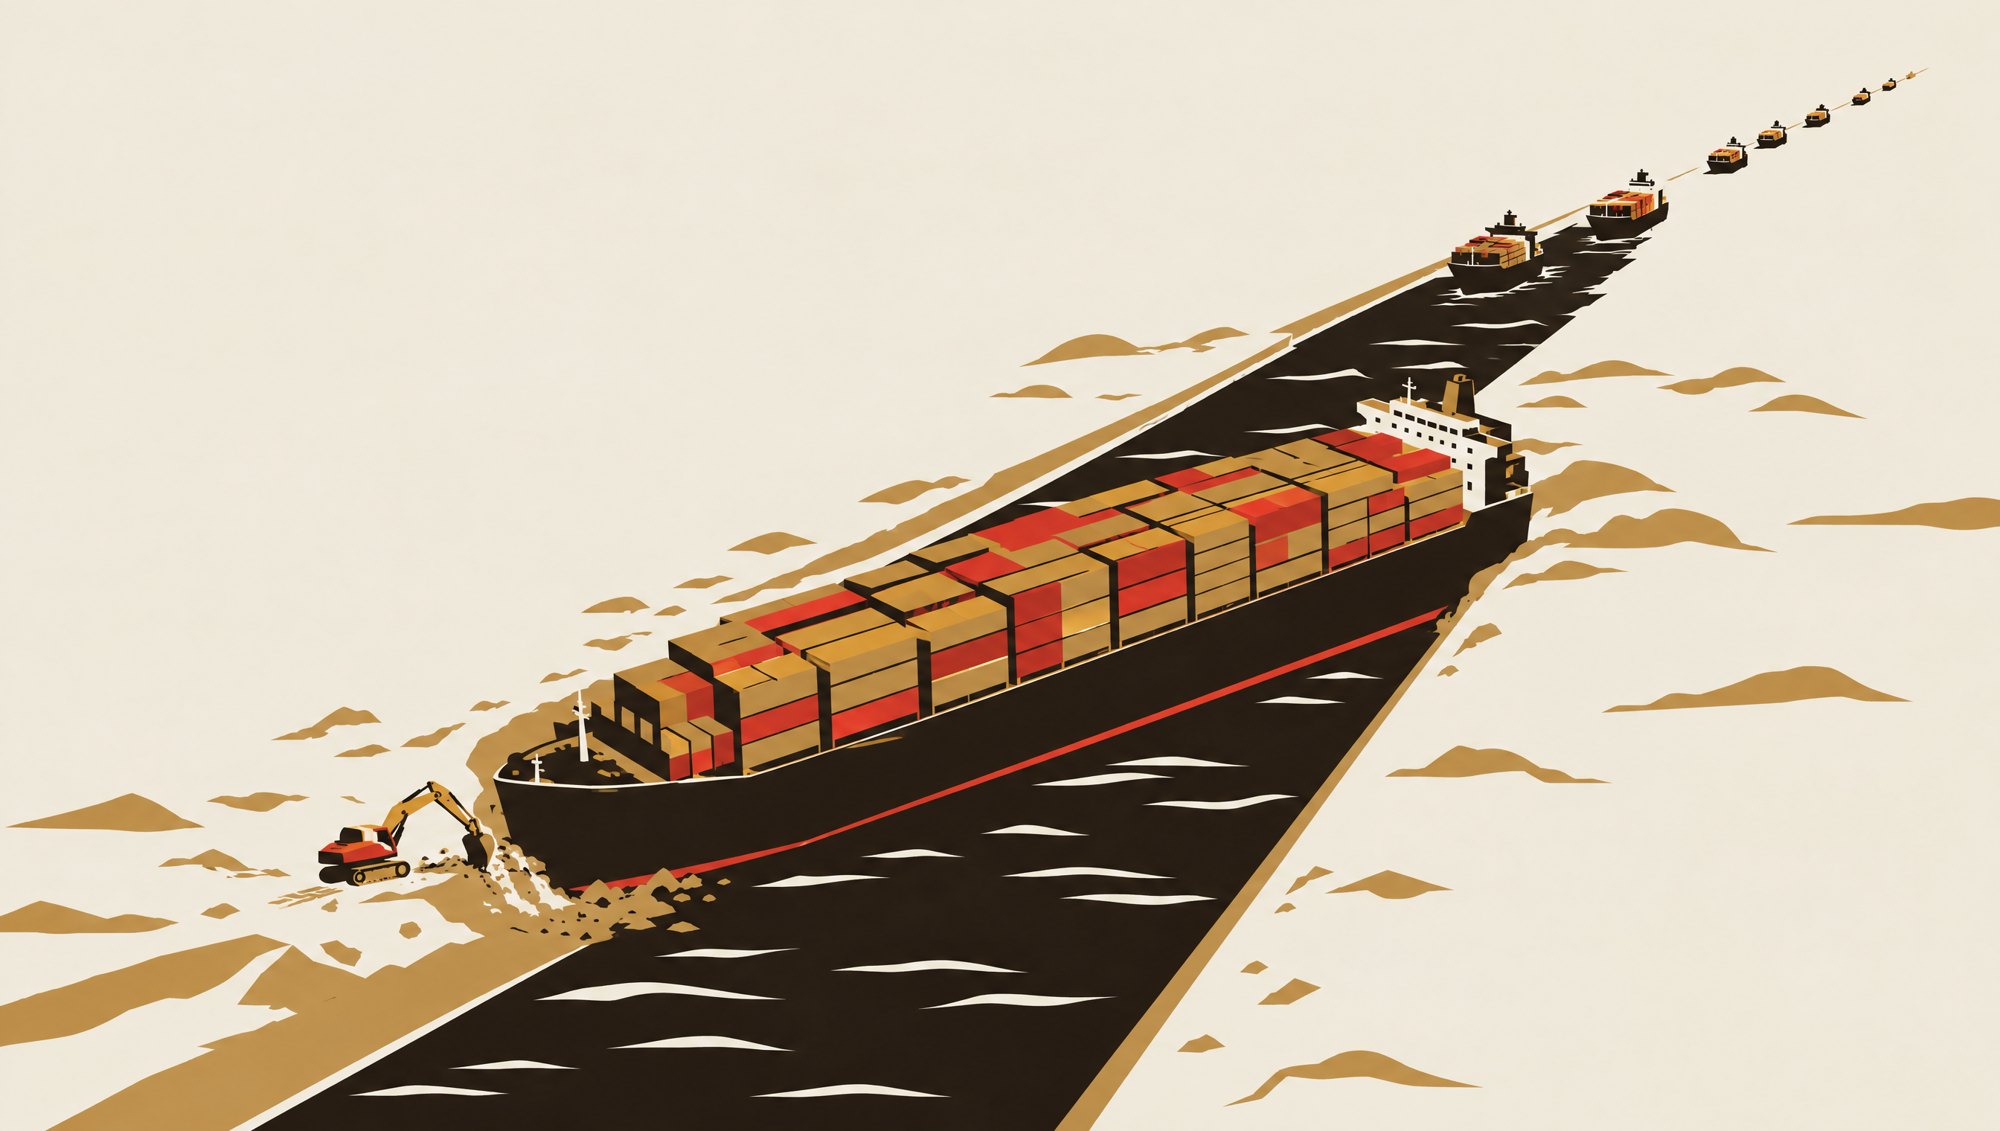
A Ship in a Ditch
On 23 March 2021, a ship turned sideways. The Ever Given, one of the largest container ships afloat, was pushed off course in high winds in the southern stretch of the Suez Canal and wedged itself diagonally from bank to bank.
For six days nothing passed. Dredgers dug at the bow and tugs pulled at the stern. The ship was refloated on 29 March. By then, according to the chairman of the Suez Canal Authority, at least 369 vessels were waiting to transit: container ships, bulk carriers, oil tankers and gas carriers. The industry newspaper Lloyd's List estimated that the blockage was holding up around $9.6 billion of goods a day.
The image was irresistible because it made visible something that is normally invisible. A large share of the world's trade passes through a small number of narrow places, and the prices of things far from those places depend on them staying open.
What a blockage does to a price
It is tempting to draw a straight line from the canal to a shop shelf. The real chain is slower and softer. A blockage first creates a queue. The queue adds days to voyages, and some ships choose to divert around the Cape of Good Hope instead, adding a week or more. Longer voyages tie up ships and containers, which reduces how much capacity the fleet can offer, which raises freight rates on routes that have nothing to
do with the canal. Cargo arrives late and in bunches, and ports at the other end become congested weeks after the ship has moved.
Only then does any of this reach the price of goods, and by an amount that depends on how much freight matters to the good. Freight is a large share of the cost of a container of furniture and a small share of the cost of a container of phones. Retailers with inventory absorb some of the shock; those without it pass it on or run out. There is no single pass-through number, and anyone who quotes one is guessing.
Narrower places than Suez
The Suez blockage lasted six days. Other chokepoints have been disrupted for much longer, and in ways that show the same mechanics more clearly. From late 2023, attacks on shipping near the Bab el-Mandeb strait at the southern end of the Red Sea led most container lines to stop using the route. The Suez Canal Authority reported 13,213 transits in 2024, about half the previous year. Ships went around Africa instead. The canal was open. The route was closed by risk, and the price of that risk showed up in insurance premiums, voyage times and freight rates.
In 2023 the Panama Canal was closed by weather. A drought lowered Gatun Lake, which feeds the canal's locks, and the canal authority cut the maximum draught of ships and the number allowed through each day, from a normal 36 to as few as 22 at the worst point. Transits in the canal's 2024 fiscal year fell 29%. Ship owners bid for scarce transit slots in auctions, and some slots sold for millions of dollars, a price for passing through a lock.
The Strait of Hormuz is the one analysts worry about most. The US Energy Information Administration estimated that about 20 million barrels a day of oil moved through it in 2024, around a fifth of global consumption, with limited pipeline alternatives for most of it. A closure there would not be a queue. It would be a hole in the world's supply, and every oil price on every screen would be repriced against it.

The price of a detour
The alternative to a chokepoint is usually a longer route, and the length is a price that can be read from a map. For a ship between East Asia and northern Europe, going around the Cape of Good Hope instead of through Suez adds roughly 3,500 nautical miles and ten days or more. Those days cost fuel, crew wages and the charter rate of the ship, and they reduce how many voyages the world's fleet can make in a year, which is why freight rates on routes far from the Red Sea rose when ships began avoiding it.
| 23 Mar | Obstruction | Ever Given grounds diagonally across the canal |
| 24-28 Mar | Queue | Ships stack up at both ends; some turn for the Cape |
| 29 Mar | Refloated | At least 369 vessels waiting, per the Canal Authority |
| Early Apr | Voyage time | Backlog clears; late ships arrive in bunches |
| Weeks after | Freight | Delays tie up ships and boxes on other routes |
| Months after | Inventory and prices | Some costs pass through, unevenly, not one to one |
Risk is priced too, separately and explicitly. Ships entering an area underwriters list as high risk pay an additional war risk premium for each voyage, quoted as a share of the value of the hull. After the attacks began, premiums for Red Sea transits rose many times over. For a large, valuable ship, a single passage could carry an insurance cost comparable to the saving on fuel from the short route, and the calculation that had sent ships through Suez for decades reversed.

Maps are prices
The map on the next two pages is drawn with almost no borders, because political lines explain little here. What matters is where water narrows, what passes through, and what the alternatives cost. Every chokepoint is, in effect, a price that the market pays continuously and notices only when it changes: the price of the short route, over the long one.
None of this is new. Merchants have always priced routes: the Cape route replaced overland spice roads, the Suez Canal made the Cape a detour when it opened in 1869, and the Panama Canal did the same for the long voyage around South America in 1914. What is new is how finely the price is now quoted, by the day, by the voyage and by the risk, and how quickly it reaches screens that have never heard of the strait.
A ship turned sideways for six days. Nothing on board changed price. The distance around it did.
| Chokepoint | What moves through | If it stops | |
|---|---|---|---|
| 01 | Strait of Hormuz | ~20 million b/d of oil in 2024, about a fifth of world consumption (EIA) | Few pipeline bypasses; oil prices everywhere reprice |
| 02 | Strait of Malacca | The short sea route from the Indian Ocean to East Asia; among the largest oil chokepoints (EIA) | Diversion through Indonesian straits adds days |
| 03 | Bab el-Mandeb | Southern gate of the Red Sea and the Suez route | Since late 2023 attacks: ships round Africa, Suez transits roughly halved in 2024 |
| 04 | Suez Canal | Asia-Europe container trade, tankers, bulk carriers | Ever Given 2021: six days, 369 ships waiting |
| Chokepoint | What moves through | If it stops | |
|---|---|---|---|
| 05 | Panama Canal | US East Coast to Asia, LNG, grain | 2023 drought: 36 daily transits cut to 22; FY2024 transits down 29% |
| 06 | Turkish Straits | Black Sea grain and oil to the Mediterranean | No sea alternative for Black Sea ports |
| 07 | Cape of Good Hope | The long way round, not a chokepoint: the alternative | Busier when the Red Sea closes |
| ms | venue | last print | unit |
|---|---|---|---|
| +135 | bybit | 75,843.20 | tether |
| +123 | okx | 75,837.10 | tether |
| +164 | coinbase | 75,741.87 | dollars |

What Waiting Costs
Would you rather have $100 today, or $100 in ten years? Almost nobody hesitates. The more interesting question is how much less than $100 you would accept today instead of waiting, because the answer is a price, and it sits inside nearly every other price in this issue.
There are three reasons to prefer money now. You might want to spend it now. Prices might rise in the meantime, so $100 later buys less. And a promise to pay later might not be kept. Put numbers on those three reasons
and you have an interest rate: the price of time.
Discounting, without the jargon
If you could lend money safely at 4% a year, $100 in ten years is worth what you would need to lend today to end up with $100: $67.56. At 2% it is worth $82.03. At 8% it is worth $46.32. The future payment has not changed. Its value today has, because the price of time has.
That calculation is called discounting, and the value it produces is called present value. The rate used starts from something close to riskless, conventionally the yield on government debt of the right maturity, and adds a premium for whatever makes the particular payment less certain.
Why distance matters
The further away a payment is, the more its value today depends on the rate. A payment of $100 due in one year is worth $96.15 at 4% and $95.24 at 5%: a difference of less than one per cent. A payment of $100 due in thirty years is worth $30.83 at 4% and $23.14 at 5%, a fall of 25%. One percentage point, applied over thirty years, takes a quarter off the value.
Bond traders call that sensitivity duration. It explains why long-dated bonds lose more than short ones when rates rise. It also explains something that seems unrelated: why the prices of companies whose profits are mostly expected far in the future, young technology firms for instance, tend to fall harder when rates rise than companies earning steady cash today.
The same clock, in other markets
Property is valued by discounting rents. When the rates investors demand rise, the value of the same building with the same tenants falls, even though nothing about the building has changed. A pension promise is a stream of future payments, and the amount a fund must hold to meet it depends on the rate used to discount them, which is why pension deficits can swing by large sums with no change in the number of pensioners.
Assets that pay nothing are affected by the same clock from the other side. Gold pays no interest, so holding it means giving up whatever interest the money could have earned. When safe rates are high, that sacrifice is larger. The same logic applies, contested and loosely, to bitcoin.
A price of time you can watch
Crypto markets built an unusually visible price of time. A perpetual future is a contract with no expiry that is meant to track the spot price. To keep it close, the exchange makes one side pay the other every few hours: when the perpetual trades above the index, holders of long positions pay

| Rate | $100 in 1 year | in 10 years | in 30 years |
|---|---|---|---|
| 2% | $98.04 | $82.03 | $55.21 |
| 4% | $96.15 | $67.56 | $30.83 |
| 5% | $95.24 | $61.39 | $23.14 |
| 6% | $94.34 | $55.84 | $17.41 |
| 8% | $92.59 | $46.32 | $9.94 |
holders of short positions, and the reverse when it trades below. That payment is called the funding rate.
In effect it is an interest rate on borrowed exposure, set by the market every few hours, and it is published openly. When many traders want leveraged long positions, funding rises and the price of borrowing bitcoin exposure goes up. When the enthusiasm fades, it falls and can turn negative. A cash-and-carry trader who buys spot and sells the perpetual collects it, which pulls it back toward the cost of money elsewhere.
It is the same mechanism as a bank deposit rate or a Treasury yield, compressed into hours and stripped of most of its institutions. Central banks do not hand down the price of time on their own. Wherever someone wants something now and someone else can wait, a rate appears.
The restraint
This is the point where articles about interest rates usually overreach, and it is worth being careful. Rates are an input to almost every price. They do not cause every price movement. Plenty of assets have risen while rates rose and fallen while they fell, because the other inputs, expected cash flows, risk, supply and demand for the asset itself, moved more. A central bank sets one short-term rate. Markets set the rest, and the premiums added on top of them move for reasons of their own.
What can be said without overreaching is this. Any price that describes a claim on the future contains a rate, whether the screen shows it or not. When the rate changes and nothing else does, the price must change. Most of the time plenty of other things change as well.
One practical habit follows. When a price moves, before explaining it with a story about the asset, check what happened to the price of time on the same day. If long-dated rates jumped, a good part of the move in anything whose value lies far in the future may simply be the clock being re-set. If rates were still, the story has to come from somewhere else.
Two identical claims to $100, one due today and one due in 2036. Put them side by side, and the gap between them is the price of ten years.
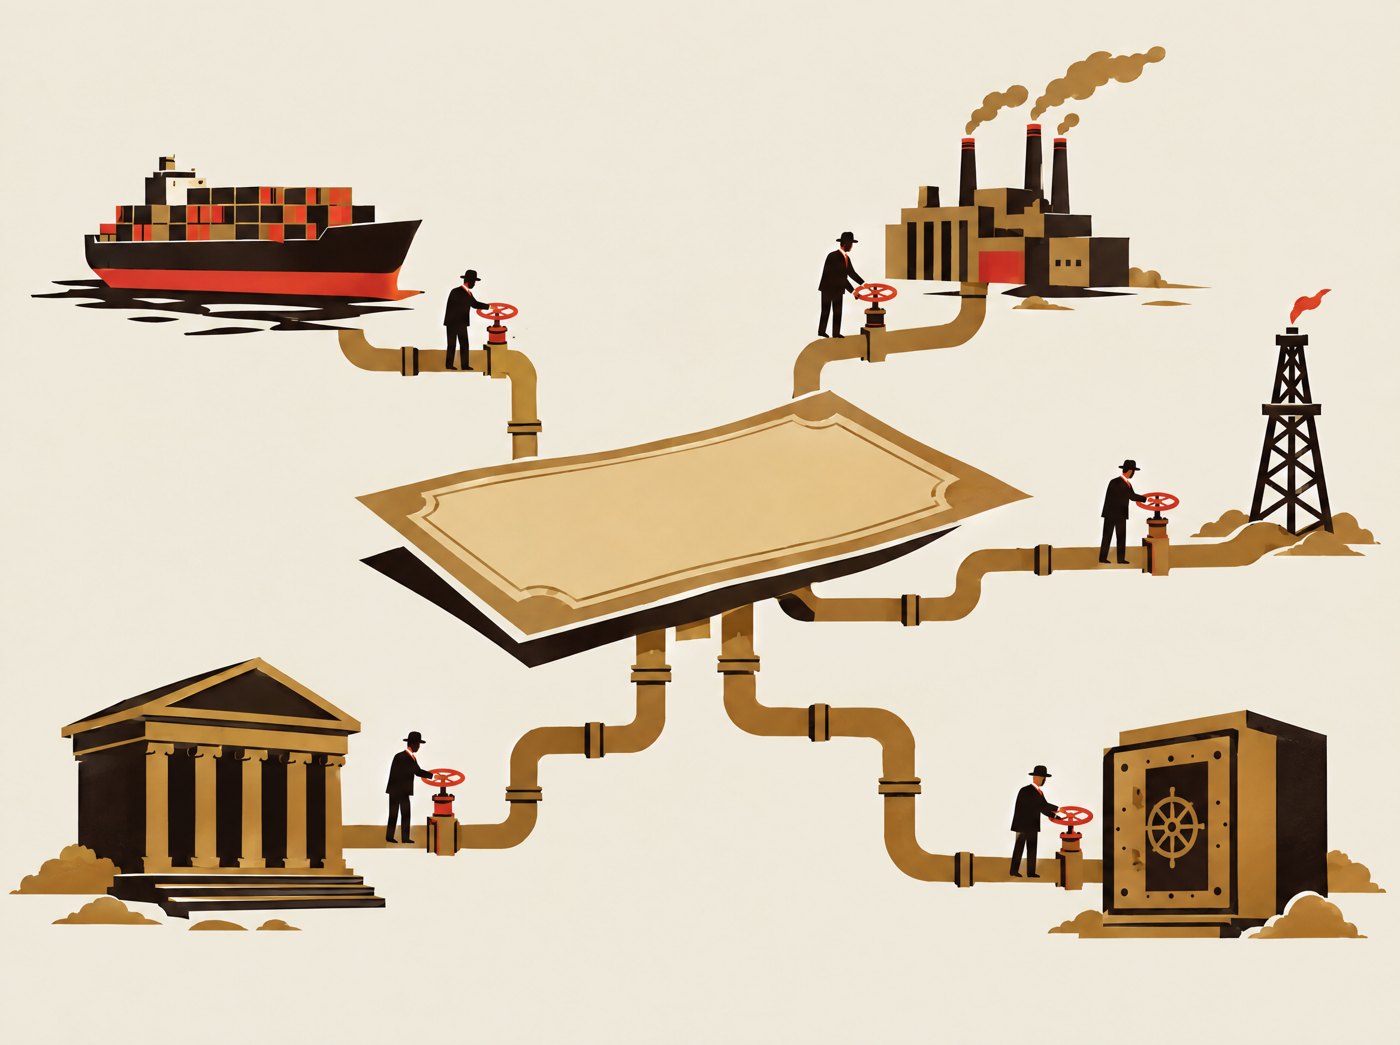
The Dollar Inside Everything
A coffee farmer in Vietnam, a copper mine in Chile and a shipping company in Denmark may never deal with an American. Much of what they sell is still priced, invoiced, financed or hedged in US dollars. The dollar is inside a very large number of prices that have nothing to do with the United States.
No conspiracy here, and no obituary. Just plumbing: the pipes through which money moves between countries, and why so many of them are sized in one currency.
Invoices
Start with trade. Oil benchmarks are quoted in dollars, and so are most internationally traded metals and many agricultural commodities. Beyond commodities, economists at the IMF and elsewhere have found that the dollar's share of invoicing in world trade is several times larger than the United States' own share of world trade. A Korean exporter selling to Brazil will very often write the invoice in dollars.
That choice spreads. If your sales are in dollars, it is convenient to borrow in dollars, because your revenue matches your debt. If your suppliers invoice in dollars, you hold dollars to pay them. Each of those decisions is sensible on its own, and together they make the dollar the default.
Money that settles money
The foreign exchange market is the largest market in the world by turnover. In the Bank for International Settlements' 2022 survey, the dollar was on one side of 88% of all trades, and its share was slightly higher in the 2025 survey. Most pairs of other currencies are traded through the dollar rather than directly, because the dollar markets are deeper: it is often cheaper to change pesos to dollars and dollars to rand than to find somebody who wants to swap pesos for rand.
Central banks hold reserves largely in dollars. The IMF's COFER data put the dollar at 56.9% of allocated official reserves in the third quarter of 2025, down from much higher levels at the start of the century and still far above any other currency.
Collateral and funding
Underneath trade and reserves sits funding. Banks and companies outside the United States have borrowed trillions of dollars, and banks outside the US hold dollar assets financed with short-term dollar borrowing. US Treasury securities are the collateral of choice in much of that borrowing, including the repo market on which SOFR, described in Act I, is built.
The consequence shows up in bad weeks. When investors everywhere rush for safety at once, they want dollars, and borrowers outside the US who need dollars to roll their debts find them expensive or unavailable. In March 2020 the Federal Reserve extended dollar swap lines, arrangements to lend dollars to other central banks against their own currencies, to a wider group of countries, precisely to ease that pressure.

New rails, same currency
Crypto markets reproduce the pattern. The largest stablecoins, tokens designed to hold a steady value, are almost all denominated in dollars, and as the cover story showed, four of the five venues in this issue's frozen second priced bitcoin in a
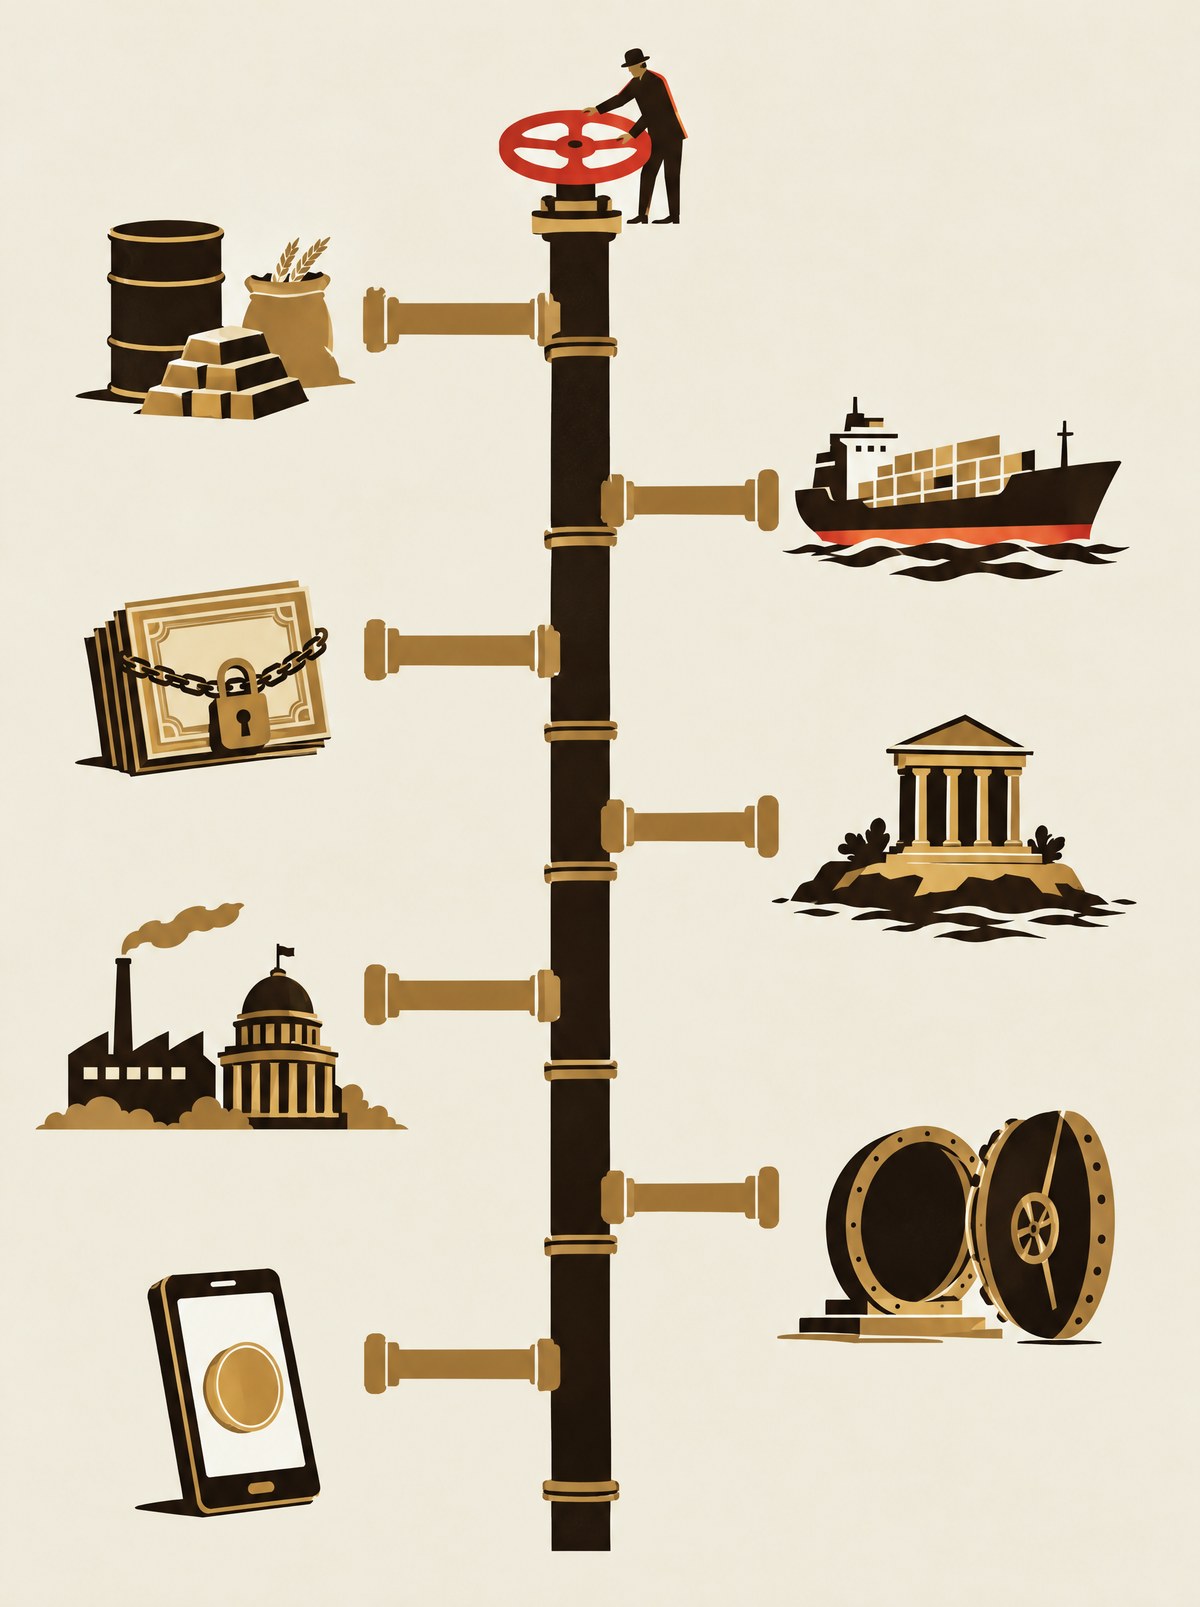
dollar token rather than in dollars. A trader in Asia buying bitcoin on those venues is, one layer down, making a decision priced in the dollar.
Dollars that never lived in America
A large share of the world's dollars are held and lent outside the United States. The market has a history. In the 1950s and 1960s banks in London began taking deposits and making loans in dollars, outside the reach of American banking rules. The dollars held abroad this way came to be called eurodollars, after the European banks that first held them. They have nothing to do with the euro, which did not yet exist.
That offshore dollar system grew into the main way the rest of the world borrows the currency. LIBOR, the rate discussed in Act I, was the price of borrowing those offshore dollars between banks. Its replacement, SOFR, is a rate on borrowing inside the American Treasury market. The move from one to the other is also a move from a price made in London to a price made in New York.
Offshore dollars have no central bank of their own. A bank in Seoul or Frankfurt that has lent dollars it borrowed short-term cannot print more when the lending stops. That is why, in the worst weeks, the price of dollars outside the United States can rise faster than inside it, and why the Federal Reserve's swap lines matter far beyond America.
What the plumbing does and does not mean
A connection says nothing about its strength. The dollar's exchange rate does not move a dollar-invoiced commodity one for one; supply and demand for the commodity move it too, often far more. An emerging market with dollar debts is more exposed to a strong dollar than one without, by an amount that depends on its revenue, its reserves and its policy. The plumbing tells you where pressure can travel. It does not tell you how much will arrive.

It also does not tell you how long the arrangement lasts. Reserve shares move slowly, over decades; the dollar's share has fallen from above 70% around the turn of the century to below 60% now, while its role in trading and funding has barely moved. Plumbing is hard to replace, because every pipe is connected to every other, and because the value of a common currency comes precisely from the fact that everybody else is already using it.
The dollar sets very few prices directly. A surprising share of the world's prices still flow through it.

A price made with hands
Before matching engines, futures prices were made in stepped octagonal pits by traders shouting and signalling. A palm turned toward the body meant buying; a palm turned out meant selling. Fingers gave quantity and price.
Trades were scribbled on cards and reconciled later, and prices were posted by exchange staff watching the crowd. The step you stood on was information: the closer to the centre, the closer to the flow. CME closed most of its futures pits in July 2015.
IN THE WHEAT PIT OF THE BOARD OF TRADE OF THE CITY OF CHICAGO, 1920 · Library of Congress, public domain (LCCN 2013646364) · photograph, toned to the page. The next page returns to the screen.

We Asked for a Price
- QUESTION
- If you ask for the price of one bitcoin, how many answers are there?
- METHOD
- Nine public endpoints requested in parallel from one server. We recorded send and receive times, the raw number and the service's own timestamp where one was given. No retries, no editing.
- DATE
- 2026-09-16 15:38:52.188 UTC. Another second from the one this issue is built on: price services cannot be queried for the past.
- SAMPLE
- One request each. Chosen for being public, free and documented, not for being representative.
- LIMITS
- One moment only; another second would give other numbers. Services without timestamps cannot be aged.
- RESULT
- Nine different numbers, explained by definitions, units and ages rather than by error.
| Service | What it returned | Unit | Answer | Age | Round trip |
|---|---|---|---|---|---|
| Coinbase Venue spot price | Coinbase's own spot price for BTC-USD | USD | $75,666.93 | no stamp | 60 ms |
| Gemini Last trade | the most recent trade on Gemini BTC/USD | USD | $75,678.67 | 52.6 s | 425 ms |
| Bitstamp Last trade | the most recent trade on Bitstamp BTC/USD | USD | $75,689.03 | 0.2 s | 29 ms |
| OKX index Index | OKX's BTC-USD index across constituent exchanges | USD | $75,690.80 | 0.4 s | 309 ms |
| Kraken Last trade | the most recent trade on Kraken's XBT/USD book | USD | $75,691.00 | no stamp | 47 ms |
| Deribit index Index | Deribit's btc_usd index across constituent exchanges | USD | $75,691.93 | 0.0 s | 45 ms |
| CoinGecko Aggregator | an aggregate across many exchanges, refreshed periodically | USD | $75,694.00 | 112.2 s | 54 ms |
| Binance Moving average | average trade price over the last five minutes, BTC/USDT | USDT | $75,719.44 | 0.2 s | 253 ms |
| Bybit index Index | Bybit's index price for its BTCUSDT perpetual | USDT | $75,742.70 | 0.1 s | 194 ms |
On 16 September at 15:38:52.188 UTC we asked nine public price services the same question at the same moment: what does one bitcoin cost? Every request left our server within a few milliseconds of the others. All nine answered. No two gave the same number.
The answers ran from $75,666.93 to $75,742.70, a range of $75.77, about 10 basis points on a single asset, asked a single question, in the same second. It was a different second from the one the rest of the issue is built on: price services cannot be asked about the past, so we asked them about a present of our own, and every page that shows these answers is stamped with that other second.
None of them is wrong. Each answered a slightly different question and says which one in its documentation. The dispersion is the visible difference between definitions.
Nine questions that sound like one
Three services, Kraken, Bitstamp and Gemini, returned the last trade on their own books: the price at which somebody most recently bought or sold there, however small the trade and however long ago. Coinbase returned its own spot price for its dollar market. OKX, Deribit and Bybit returned indices, each built from a basket of other exchanges by their own rules, the kind of number page 19 took apart. CoinGecko returned an aggregate across a very large number of venues.
Binance returned something else again: the average trade price over the previous five minutes, in tether. It answered a question about the recent past, not the present, in a different unit. Bybit's index was also in tether. The two highest answers in our sample were the two denominated in tether, which is exactly what page 12 would predict.
The ages
Some services stamp their answers with the time the number was made. Most of those stamps were a fraction of a second old. CoinGecko's was 112 seconds old when it reached us. It was not broken; it refreshes on a schedule, and between refreshes the last number stands, precisely like a quote on a quiet venue. Three services gave no timestamp at all, so we cannot say how old their numbers were. We can only say when we received them.
Which one was right?
Each, for its purpose. A trader on Kraken needs Kraken's book. A futures exchange deciding whether to liquidate somebody needs an index no single venue can push. An accountant needs a documented source at a documented time. The mistake is the belief that there was a tenth number underneath the nine that was simply the price. If machines looking at the most liquid object of its kind disagree by tens of dollars, nobody should be surprised when people pricing a painting, a house or a used car disagree by far more.
We asked nine times and got nine answers. We report all nine, with their definitions, their ages and their units, and we do not average them.

Somebody Knows Something
Look at the six lines on page 92 before reading on. Each shows three days of a price, sampled every few minutes. One of them is bitcoin between 13 and 15 September, from our own oracle. The other five were made by a computer tossing a coin: each step up or down is random, sized to match the real series. Try to pick the real one.
Most people cannot, and the ones who can usually cannot say why. Every line has trends, reversals, shelves where it rested, spikes that look like news. The random ones have them too. They have to: that is what randomness looks like when you draw it.
We see faces in clouds
The human habit of finding meaningful patterns in noise has a name, apophenia, and in markets it has a long paper trail. In 1959 the statistician Harry Roberts published a short article in the Journal of Finance showing that series built from random numbers produce the same head-and-shoulders formations and support levels that chart readers were selling as signals. The article did not stop anyone. The patterns are too persuasive to give up because a statistician generated some.
The science of streaks is humbler than either side of the argument would like. In 1985 Thomas Gilovich, Robert Vallone and Amos Tversky analysed basketball shooting and concluded that the hot hand, the belief that a player who has hit several shots is more likely to hit the next, was an illusion. Three decades later Joshua Miller and Adam Sanjurjo showed that the original method contained a subtle statistical bias, and that corrected, the data suggest a modest hot hand after all. Streaks are neither always real nor always false, and careful experts misread them, in both directions, for thirty years.
Sometimes somebody does know something
The feeling that a move means something is far from stupid. Sometimes it is exactly right. Markets contain people who know more than others: about a company, about a large order that is coming, about a regulator's decision. Economists model it directly. In Albert Kyle's 1985 model an informed trader hides their buying inside ordinary noisy flow, and a market maker, unable to tell which orders are informed, moves prices against all of them a little.

That is what page 55 of this issue shows from the other side. Nineteen milliseconds after a burst of buying on Bybit, the spread there went from ten cents to $12.80. Whoever was quoting did not know whether the buyer knew something. They behaved as if they might. Market makers do not need to find the informed trader. They only need to price the possibility, and that possibility is part of every spread you cross.
Somebody usually does know something. The trouble is that the price alone cannot tell you which moves carry information and which are the coin landing heads four times in a row.
Story, then flow, then price
Most of the time what moves a price is a story. The economist Robert Shiller has argued that narratives spread through a population much as epidemics do, and that their spread changes what people do with money. A story becomes flow when enough people act on it. Flow becomes price when
there is not enough on the other side of the book.
In January 2021 a story about a heavily shorted video game retailer spread through an online forum. Shares of GameStop, which began the month under $20, traded as high as $483 on 28 January. That morning several retail brokers restricted customers from buying more. The price fell by more than half within days. Nothing about the company's shops had changed during those weeks. The story, the flow and the book had.
The number you saw first
Patterns are one trap. The price we already know is another. In a 1974 experiment Amos Tversky and Daniel Kahneman spun a wheel of fortune, rigged to stop at 10 or at 65, in front of their subjects, then asked what share of African countries were members of the United Nations. The wheel had nothing to do with the question. Those who saw 10 gave a median answer of 25%. Those who saw 65 said 45.
Markets are full of wheels. The price you bought at, last year's high, a round number on a screen: each one pulls the next judgement towards itself. In 1998 Terrance Odean followed about 10,000 accounts at a discount broker and found that investors sold shares that had risen since purchase far more readily than shares that had fallen. The winners they sold went on to beat the losers they kept by 3.4 percentage points over the following year. The purchase price was information about the investor. They treated it as information about the share.
Page 11 asks five questions of every number, and one of them is how old it is. The price in your head is the oldest number in the room, and the only one that feels like yours.
What the patterns cost
Acting on patterns is expensive in a way that is easy to measure. In a study of more than 66,000 American brokerage households from 1991 to 1996, Brad Barber and Terrance Odean found that the fifth who traded most earned an average net return of 11.4% a year, while the market returned 17.9. Their trades were not all wrong. They were numerous, and each one paid a spread and a commission, the same arithmetic that page 40 of this issue shows for a small order in a thin book.
Nobody can stop seeing patterns. The defence is to ask, before acting on one, what it would look like if it were noise, and to remember that page 92 is the answer to that question.
A price is where stories meet money. The chart records the meeting. It does not explain it.
| ms | venue | bid | ask | BTC at ask | worth |
|---|---|---|---|---|---|
| +671 | coinbase | 75,770.82 | 75,778.04 | 0.000015 | $1.14 |
The Price of a Life
Every government that decides whether to build a safer road, tighten an air pollution rule or require a new kind of brake has to compare a cost in money with a benefit measured in deaths avoided. To compare them it needs a number.
In the United States that number is called the value of a statistical life. The Department of Transportation's guidance set it at $13.2 million for analyses in 2023 dollars and $13.7 million for 2024. The Environmental Protection Agency uses its own figure, updated for inflation and income. Other countries use other numbers and other names. Britain's Department for Transport speaks of the value of preventing a fatality.
The phrase invites a misunderstanding worth taking apart slowly. Nobody is pricing one person's life. No agency believes a person could be bought for $13.7 million, or that a life is worth that much and not a dollar more. The number refers to no identifiable person at all.
What the number actually measures
Start from small risks. Suppose a regulation would reduce the annual risk of dying in a particular kind of accident by one in 100,000, for each of a million people. Nobody knows who would have died. Across the million, the regulation is expected to prevent 10 deaths a year. Those are the statistical lives.
Now ask what people are willing to pay for small reductions in their own risk of death. Economists estimate this from how much extra pay workers accept for riskier jobs, how much people pay for safer products, and from surveys. If people, on average, would pay about $137 a year to reduce their own annual risk by one in 100,000, then a million people together would pay $137 million for a change that saves ten statistical lives. Divide one by the other and you get $13.7 million per statistical life.
That is the whole construction. The value of a statistical life is a way of adding up many people's valuations of tiny changes in risk. It

| Population affected | 1,000,000 people |
| Reduction in annual risk of death, each | 1 in 100,000 |
| Expected deaths avoided a year | 1,000,000 × 1/100,000 = 10 |
| Willingness to pay for that reduction, each | $137 a year |
| Total willingness to pay | 1,000,000 × $137 = $137,000,000 |
| Per statistical life | $137,000,000 / 10 = $13,700,000 |
| Rule | Cost | Expected benefit | Implied cost per life | Test |
|---|---|---|---|---|
| Safety rule A | $60 million a year | 8 statistical lives a year | $7.5m per life avoided | passes at $13.7m |
| Safety rule B | $400 million a year | 12 statistical lives a year | $33.3m per life avoided | fails at $13.7m |
is a price for risk, expressed per expected death, used so that a benefit measured in safety can be set beside a cost measured in money.
Why it exists
Refusing to use a number does not avoid the comparison. Every decision to spend or not spend on safety makes one implicitly. A rule that costs $500 million and is expected to prevent one death a year for twenty years has an implied value per statistical life whether anyone writes it down or not. Writing it down makes the comparison consistent across agencies and visible to the public, which can then argue with it.
It is also contested, and the contests are serious. Should the number differ by income, age or country? Agencies in the United States generally use one value for everyone, precisely to avoid valuing a poorer or older person's risk reduction less. International comparisons that adjust for income produce lower numbers for poorer countries, which is defensible as a measure of willingness to pay and uncomfortable as a statement about people.
A rule that failed the test
In 2002 a two-year-old named Cameron Gulbransen was killed when his father reversed the family car in their driveway and could not see him. Congress passed a law named after him in 2008 that told the Department of Transportation to improve rear visibility. The rule, published in 2014, required rear-view cameras in new light vehicles from May 2018. The agency's own analysis put the rule's own effect at 13 to 15 deaths prevented a year, at a net cost of $15.9 million to $26.3 million for each equivalent life saved: well above the value of a statistical life it used at the time. Once every vehicle on the road carried a camera, it expected 58 to 69 lives saved a year. The rule went ahead because Congress had required it. The gap was written down, published, and chosen in the open.
Values also differ between agencies and between countries. Britain's transport appraisal uses a figure far lower in pounds than the American one in dollars. The spread is no scandal. This issue found the same thing in nine price services answering one question: different definitions, different inputs, different purposes.
The boundary of the issue
This is as far as the idea of a price can be pushed. A value of a statistical life is constructed, like an index. It is contested, like a benchmark. It depends on who is asked and how, like an appraisal. And it is used to decide real things, like a mark. Everything this issue has said about prices applies to it.
What does not apply is exchange. Nobody can sell a statistical life or buy one. The number exists because decisions must be made and money must be compared with something that is not money. It is a price in every sense except the one most people mean.
The number was never about one person. It is about everyone, a little.
The Last Trade
The number at the top of this page was on our screen at 07:24:04 on 16 September, in the same second this whole issue is built on. It was Kraken's best bid for bitcoin, as our collector recorded it: $76,007.30, for 0.0537 bitcoin.
It was $256 above Kraken's own best offer at the same moment, which is impossible in a working order book: a buyer willing to pay more than a seller is asking would simply have traded with them. The level had last traded 18 minutes earlier, at 07:06:00. It stayed at the top of our record of Kraken's book, unchanged, for 56 minutes.
The venue had not made a mistake. We had. Our collector subscribed to the top ten levels of Kraken's book. When a level moved out of that window, Kraken simply stopped sending updates about it, and our code, which only removed levels when told their size was zero, kept it forever. We found the bug while preparing this issue, fixed it the same day, and withheld Kraken from every table in the issue. But the ghost bid is a perfect specimen for this article, because it looked exactly like a price.
Is it still a price?
Every displayed price is a statement about the past. For a liquid market the past is milliseconds old and the statement is nearly true of the present. As the age grows, the same number means less. It does not become wrong all at once. It decays.
A last trade from a second ago tells you roughly where you could trade now. From an hour ago, it tells you where the market was. From a month ago, it tells you what somebody once paid. From five years ago, on an instrument that has not traded since, it tells you almost nothing about value and a good deal about history.
Screens rarely say so. Most displays show a number without its age, in the same type and colour whether it is fresh or years old.
How prices go stale
Trading halts are the everyday case. An exchange stops trading in a share pending
| Trade | Tells you where you could trade now, at that size |
| Seconds | Close to executable on a liquid venue; our frozen second lives here |
| Minutes | Where the market was; our ghost Kraken bid, 18 minutes stale |
| Days | Halted shares, closed markets: Moscow, 28 Feb to 24 Mar 2022 |
| Months | Private assets, delisted instruments, tokens whose venues have closed |
news, and the last price sits on every screen until trading resumes. It may resume far away. Circuit breakers do the same across whole markets for minutes.
Closed markets are the larger case. After Russia invaded Ukraine in February 2022, the Moscow Exchange kept its stock market shut from 28 February until 24 March, and the London Stock Exchange suspended trading in the depositary receipts of many Russian companies in early March. For weeks their last prices remained on screens and in index calculations and fund valuations, describing a market that did not exist in any form an investor could use.
Delisting leaves a last price permanently. A company taken private, a fund wound up, a token whose venues have closed: each has a final print that will stay in databases forever, perfectly accurate as history.
Private assets live permanently in this condition. A private equity fund reports the value of companies that have not traded, usually quarterly and with a lag, based on appraisals, comparable listed companies and recent funding rounds. Its reported value can stay calm through a market fall that would have repriced the same companies on an exchange within days.
The quiet version
Most stale prices are not dramatic. A bond that trades a few times a month is marked every day by a pricing service using quotes and models. A property fund values its buildings every quarter. A small company's shares trade a few hundred times a day, and its last price at the close may be from a trade of a few shares an hour earlier. Each of these numbers is reasonable. Each is also, quietly, a statement about some time ago, set in the present tense.

The danger lies in combining them. A portfolio that holds a liquid index fund and an illiquid private fund shows a total that adds a price from this minute to a price from last quarter. In a falling market the total looks steadier than anything inside it really is.
What to ask of any number
The defence is simple and almost never used. For any price, ask how old it is. Ask when the instrument last traded, and in what size. Ask whether the market it came from is open. Ask whether the source is still sending updates, or whether a number is merely still there, which, as our own collector demonstrated, can look identical.
Our ghost bid was a real number, correctly stored, faithfully displayed. It had simply stopped being a price 56 minutes before we noticed, and nothing on the screen said so.
This issue has spent a hundred pages showing that prices are imperfect. They are late. They depend on size and unit and venue. They can be constructed by committees, frozen by bugs, cancelled by exchanges, and quoted long after they stopped meaning anything. All of that is true. None of it touches the strongest reason we use prices at all.
In 1945 Friedrich Hayek pointed out that the knowledge needed to run an economy does not exist in any one place. It is scattered among millions of people as knowledge of particular circumstances: that this warehouse is nearly empty, that this harvest looks poor, that this ship will be late, that this buyer is about to walk away. Nobody can collect it. Much of it cannot even be written down. A price is how it gets used anyway. When a farmer who has seen the rain holds back grain, the price rises for a baker who has not, and the baker economises without ever learning why.
The alternatives to prices are not perfect numbers. They are stories and committees. A story is a single person's account of what matters, however well informed, and it is usually wrong about something it did not know to look at. A committee aggregates more views, slowly, and filtered through whoever chairs it. The twentieth century ran a large experiment in replacing prices with plans, and the planners' consistent complaint was that they could not find out what anything was really worth.
Markets are not wise and traders are not especially clever. The claim is narrower and harder to escape: that people with money at stake, acting on what they each know, produce a number that incorporates more of what is known than any alternative method we have found. It is why
forecasters who beat market prices consistently are so rare, and why prediction markets have often matched or beaten expert panels.
The flaws this issue describes are, mostly, flaws that markets reveal about themselves. The dispersion across five venues was nine basis points and corrected continuously by arbitrage. LIBOR failed because it was not a market price, and was replaced by one. The nickel episode was, among other things, a market telling everybody with enormous force that a very large short position could not be delivered. A stale last trade is a problem precisely because the market that would have updated it is absent.
It is fair to insist that every price comes with its definition, its age and its size. It is a mistake to move from there to the idea that prices are just one story among many. Stories are cheap to tell. Prices are expensive to move, because moving them costs the mover money if they are wrong. That cost is the reason the number deserves more trust than the narrative around it.
Nor does the imperfection of prices recommend any particular replacement. The honest alternative to a noisy market price is not a clean number. It is a number with the noise hidden: an appraisal that does not move because nobody has asked again, a model mark that is smooth because the model is. A price that jumps around on a bad day is doing its job. A valuation that stays calm on the same day is not being wise. It is being late.
Prices are imperfect, contextual and constructed. They still know more than we do.
| ms | venue | price | BTC |
|---|---|---|---|
| +893 | binance | 75,844.00 | 0.02000 |
| +990 | gate | 75,840.40 | 0.03242 |
Everything around it has moved.
This Page Is Already Wrong.
Scan for the price now.print.slyce.xyz/issue-01/now/
Sources
The frozen second
Own capture of public quote, trade and order-book feeds, and our own reference-price log. Receive time, not venue time. Every file behind the charts is in the data room.
01 What Is a Price?
Own capture as above. Tether redemption terms: Tether Limited. Pair units: venue API documentation.
02 The Price That Never Traded
Own capture. SPDR Gold Trust prospectus (NAV at LBMA Gold Price PM). CF Benchmarks, CME CF Bitcoin Reference Rate methodology.
03 Below Zero
CFTC staff interim report on NYMEX WTI crude oil futures trading on and around 20 April 2020 (Nov 2020). Bundesnetzagentur / SMARD, negative price hours 2023 and 2024. ECB and Bank of Japan policy rate histories.
04 Who Owns the Number?
ICE Benchmark Administration LIBOR methodology. FSA, CFTC, DOJ Barclays settlements, 27 Jun 2012. Wheatley Review, Sept 2012. FCA on cessation of the USD LIBOR panel, 2023. ARRC Second Report (2018). Federal Reserve Bank of New York, reference rate documentation. LBMA and IBA, LBMA Gold Price launch, 20 Mar 2015. FCA Final Notice to Barclays Bank plc, May 2014. S&P Dow Jones Indices methodology. US v. Eisenberg, SDNY.
Archive 01
Photographs: Men sweeping up the floor of the stock exchange, 1908 (LCCN 2013646362); Broad Street and curb brokers, New York City, 1916 (LCCN 97517304). Library of Congress, public domain, via Wikimedia Commons. Toned.
05 You Changed the Price
Own capture, Binance top-20 order book snapshots, 07:24:03.530 and 07:24:04.537 UTC.
Experiment 01
Own capture, Binance aggregated trades and top-20 order book. Binance spot fee schedule.
06 One Thing. Many Prices.
Paxos (PAX Gold) and TG Commodities (Tether Gold) issuer terms. CoinGecko simple/price and Kraken public ticker, queried 16 Sep 2026. LBMA Good Delivery rules. CME COMEX gold specifications. SPDR Gold Trust prospectus.
07 The Day the Market Cancelled Itself
Office of Financial Research Working Paper 24-09, Central Clearing and Trade Cancellation (Dec 2024). LME notice 22/053 (8 Mar 2022). R (Elliott Associates and Jane Street Global Trading) v LME, High Court, 2023. FCA Final Notice to the London Metal Exchange, 19 Mar 2025.
08 Liquidity Is Invisible Until It Isn't
Own capture. SEC and CFTC staff report on the market events of 6 May 2010. Swiss National Bank announcement, 15 Jan 2015.
09 The Price Has a Body
NYMEX light sweet crude, LME copper, CBOT wheat contract specifications. LBMA Good Delivery rules. World Gold Council, mine production.
10 A Ship in a Ditch
Suez Canal Authority statements, March and April 2021, and 2024 transit figures. Lloyd's List. Panama Canal Authority advisories (2023) and FY2024 figures. US EIA, World Oil Transit Chokepoints and Hormuz analysis (2025). Natural Earth 1:110m land.
Archive 02
Photograph: In the wheat pit of the Board of Trade of the city of Chicago, 1920 (LCCN 2013646364). Library of Congress, public domain, via Wikimedia Commons. Toned.
11 What Waiting Costs
Calculations ours. No market data used.
12 The Dollar Inside Everything
BIS Triennial Central Bank Survey 2022 and 2025. IMF COFER, 2025Q3. IMF research on invoicing currency patterns. Federal Reserve swap line announcements, March 2020.
13 We Asked for a Price
Public API responses from CoinGecko, Coinbase, Kraken, Bitstamp, Gemini, Binance, OKX, Deribit and Bybit at the stated time; each service's API documentation for definitions. Raw answers in the data room.
14 Somebody Knows Something
H. V. Roberts, Stock-Market Patterns and Financial Analysis, Journal of Finance (1959). T. Gilovich, R. Vallone, A. Tversky, The Hot Hand in Basketball, Cognitive Psychology (1985). J. B. Miller, A. Sanjurjo, Surprised by the Hot Hand Fallacy?, Econometrica (2018). A. S. Kyle, Continuous Auctions and Insider Trading, Econometrica (1985). R. J. Shiller, Narrative Economics (2019). B. M. Barber, T. Odean, Trading Is Hazardous to Your Wealth, Journal of Finance (2000). A. Tversky, D. Kahneman, Judgment under Uncertainty: Heuristics and Biases, Science (1974). T. Odean, Are Investors Reluctant to Realize Their Losses?, Journal of Finance (1998). Random walks: own calculation; real path: own oracle marks.
15 The Price of a Life
US Department of Transportation, Departmental Guidance on Valuation of a Statistical Life (2023 and 2024 values). US EPA guidelines for economic analyses. NHTSA, FMVSS No. 111 Rear Visibility, final rule and Final Regulatory Impact Analysis (March 2014).
16 The Last Trade
Own capture, Kraken BTC, 07:06:00 to 08:02:32 UTC. Moscow Exchange and London Stock Exchange notices, February and March 2022.
Dissent 02
F. A. Hayek, The Use of Knowledge in Society, American Economic Review (1945).