A Ship in a Ditch
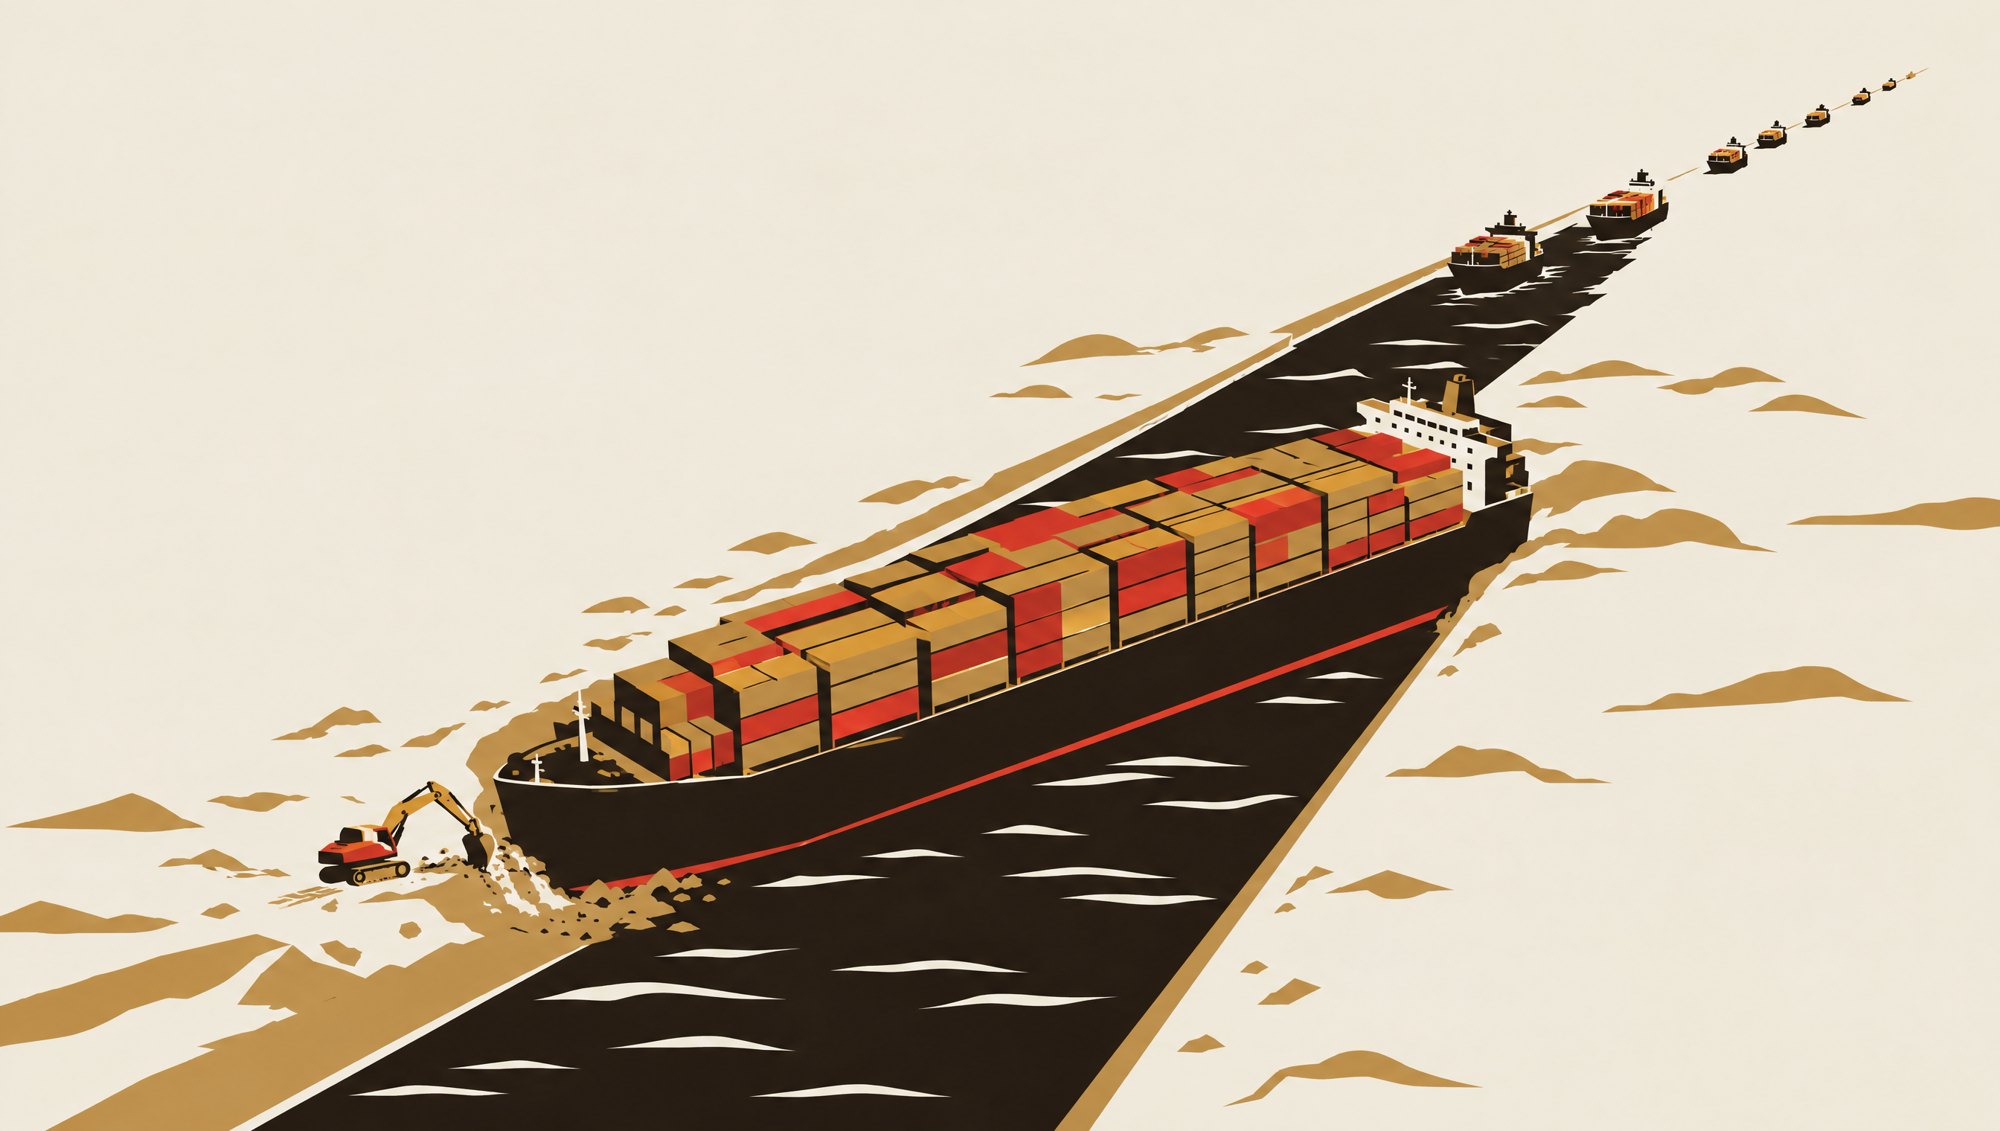
On 23 March 2021, a ship turned sideways. The Ever Given, one of the largest container ships afloat, was pushed off course in high winds in the southern stretch of the Suez Canal and wedged itself diagonally from bank to bank.
For six days nothing passed. Dredgers dug at the bow and tugs pulled at the stern. The ship was refloated on 29 March. By then, according to the chairman of the Suez Canal Authority, at least 369 vessels were waiting to transit: container ships, bulk carriers, oil tankers and gas carriers. The industry newspaper Lloyd's List estimated that the blockage was holding up around $9.6 billion of goods a day.
The image was irresistible because it made visible something that is normally invisible. A large share of the world's trade passes through a small number of narrow places, and the prices of things far from those places depend on them staying open.
What a blockage does to a price
It is tempting to draw a straight line from the canal to a shop shelf. The real chain is slower and softer. A blockage first creates a queue. The queue adds days to voyages, and some ships choose to divert around the Cape of Good Hope instead, adding a week or more. Longer voyages tie up ships and containers, which reduces how much capacity the fleet can offer, which raises freight rates on routes that have nothing to do with the canal. Cargo arrives late and in bunches, and ports at the other end become congested weeks after the ship has moved.
Only then does any of this reach the price of goods, and by an amount that depends on how much freight matters to the good. Freight is a large share of the cost of a container of furniture and a small share of the cost of a container of phones. Retailers with inventory absorb some of the shock; those without it pass it on or run out. There is no single pass-through number, and anyone who quotes one is guessing.
Narrower places than Suez
The Suez blockage lasted six days. Other chokepoints have been disrupted for much longer, and in ways that show the same mechanics more clearly. From late 2023, attacks on shipping near the Bab el-Mandeb strait at the southern end of the Red Sea led most container lines to stop using the route. The Suez Canal Authority reported 13,213 transits in 2024, about half the previous year. Ships went around Africa instead. The canal was open. The route was closed by risk, and the price of that risk showed up in insurance premiums, voyage times and freight rates.
In 2023 the Panama Canal was closed by weather. A drought lowered Gatun Lake, which feeds the canal's locks, and the canal authority cut the maximum draught of ships and the number allowed through each day, from a normal 36 to as few as 22 at the worst point. Transits in the canal's 2024 fiscal year fell 29%. Ship owners bid for scarce transit slots in auctions, and some slots sold for millions of dollars, a price for passing through a lock.
The Strait of Hormuz is the one analysts worry about most. The US Energy Information Administration estimated that about 20 million barrels a day of oil moved through it in 2024, around a fifth of global consumption, with limited pipeline alternatives for most of it. A closure there would not be a queue. It would be a hole in the world's supply, and every oil price on every screen would be repriced against it.
The price of a detour
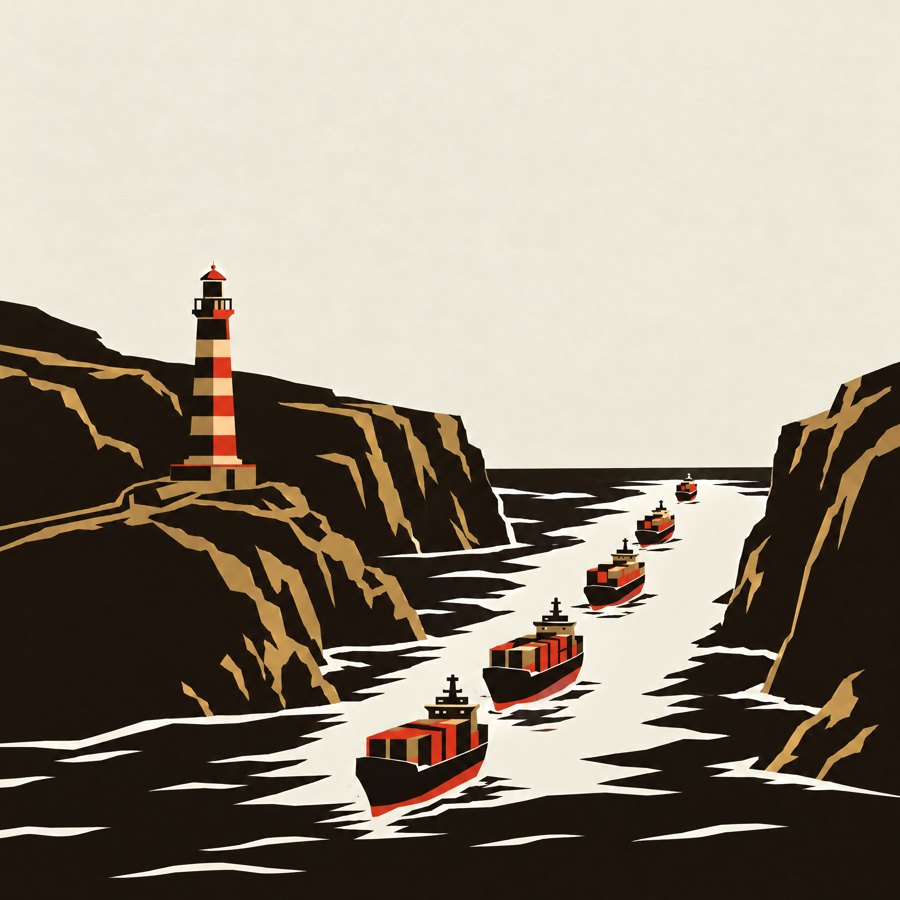
The alternative to a chokepoint is usually a longer route, and the length is a price that can be read from a map. For a ship between East Asia and northern Europe, going around the Cape of Good Hope instead of through Suez adds roughly 3,500 nautical miles and ten days or more. Those days cost fuel, crew wages and the charter rate of the ship, and they reduce how many voyages the world's fleet can make in a year, which is why freight rates on routes far from the Red Sea rose when ships began avoiding it.
| 23 Mar | Obstruction | Ever Given grounds diagonally across the canal |
| 24-28 Mar | Queue | Ships stack up at both ends; some turn for the Cape |
| 29 Mar | Refloated | At least 369 vessels waiting, per the Canal Authority |
| Early Apr | Voyage time | Backlog clears; late ships arrive in bunches |
| Weeks after | Freight | Delays tie up ships and boxes on other routes |
| Months after | Inventory and prices | Some costs pass through, unevenly, not one to one |
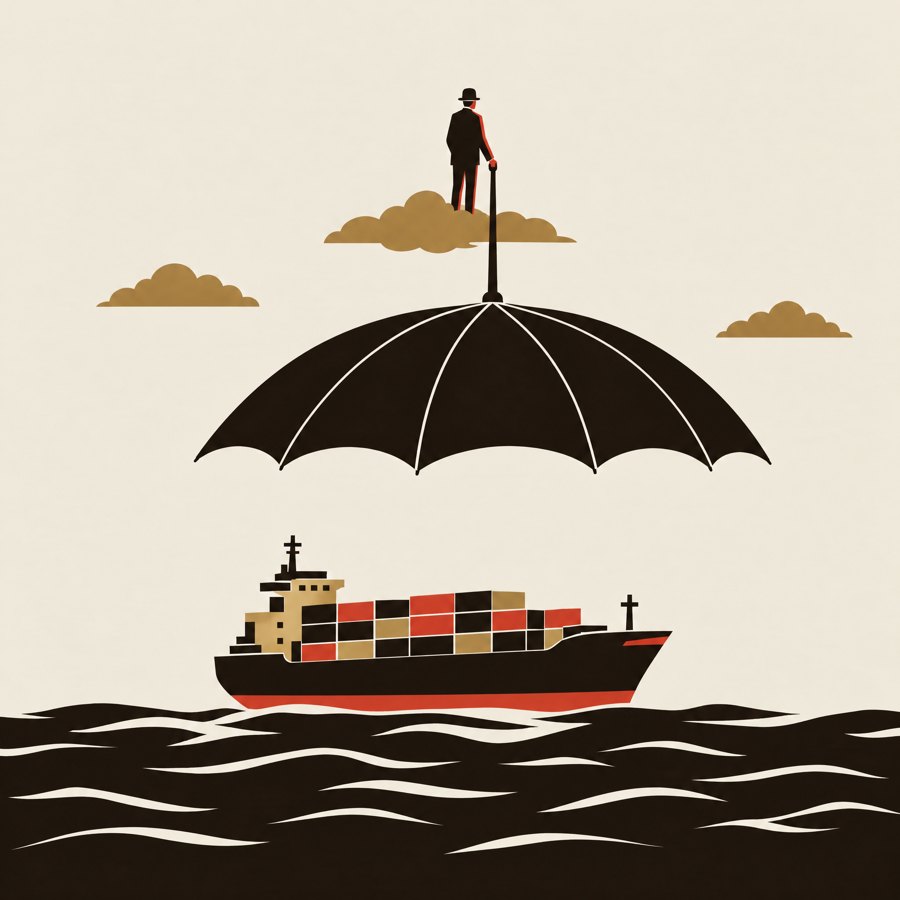
Risk is priced too, separately and explicitly. Ships entering an area underwriters list as high risk pay an additional war risk premium for each voyage, quoted as a share of the value of the hull. After the attacks began, premiums for Red Sea transits rose many times over. For a large, valuable ship, a single passage could carry an insurance cost comparable to the saving on fuel from the short route, and the calculation that had sent ships through Suez for decades reversed.
Maps are prices
The map on the next two pages is drawn with almost no borders, because political lines explain little here. What matters is where water narrows, what passes through, and what the alternatives cost. Every chokepoint is, in effect, a price that the market pays continuously and notices only when it changes: the price of the short route, over the long one.
None of this is new. Merchants have always priced routes: the Cape route replaced overland spice roads, the Suez Canal made the Cape a detour when it opened in 1869, and the Panama Canal did the same for the long voyage around South America in 1914. What is new is how finely the price is now quoted, by the day, by the voyage and by the risk, and how quickly it reaches screens that have never heard of the strait.
A ship turned sideways for six days. Nothing on board changed price. The distance around it did.
| Chokepoint | What moves through | If it stops | |
|---|---|---|---|
| 01 | Strait of Hormuz | ~20 million b/d of oil in 2024, about a fifth of world consumption (EIA) | Few pipeline bypasses; oil prices everywhere reprice |
| 02 | Strait of Malacca | The short sea route from the Indian Ocean to East Asia; among the largest oil chokepoints (EIA) | Diversion through Indonesian straits adds days |
| 03 | Bab el-Mandeb | Southern gate of the Red Sea and the Suez route | Since late 2023 attacks: ships round Africa, Suez transits roughly halved in 2024 |
| 04 | Suez Canal | Asia-Europe container trade, tankers, bulk carriers | Ever Given 2021: six days, 369 ships waiting |
| Chokepoint | What moves through | If it stops | |
|---|---|---|---|
| 05 | Panama Canal | US East Coast to Asia, LNG, grain | 2023 drought: 36 daily transits cut to 22; FY2024 transits down 29% |
| 06 | Turkish Straits | Black Sea grain and oil to the Mediterranean | No sea alternative for Black Sea ports |
| 07 | Cape of Good Hope | The long way round, not a chokepoint: the alternative | Busier when the Red Sea closes |