Somebody Knows Something

Look at the six lines on page 92 before reading on. Each shows three days of a price, sampled every few minutes. One of them is bitcoin between 13 and 15 September, from our own oracle. The other five were made by a computer tossing a coin: each step up or down is random, sized to match the real series. Try to pick the real one.
Most people cannot, and the ones who can usually cannot say why. Every line has trends, reversals, shelves where it rested, spikes that look like news. The random ones have them too. They have to: that is what randomness looks like when you draw it.
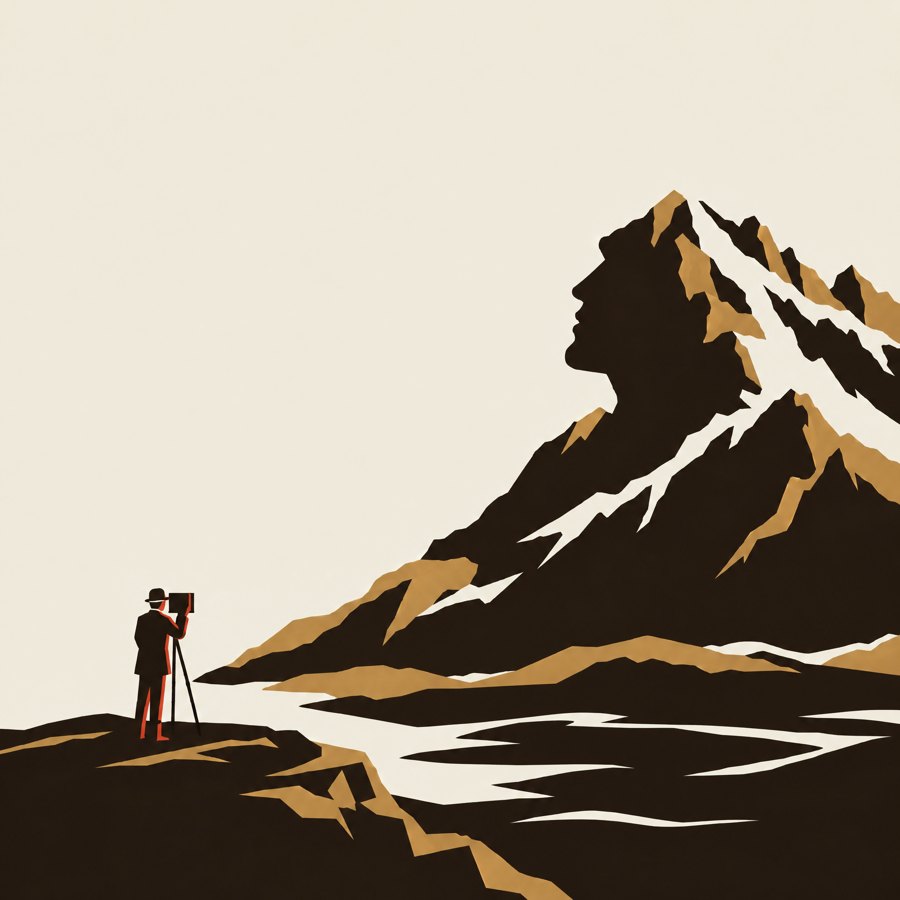
We see faces in clouds
The human habit of finding meaningful patterns in noise has a name, apophenia, and in markets it has a long paper trail. In 1959 the statistician Harry Roberts published a short article in the Journal of Finance showing that series built from random numbers produce the same head-and-shoulders formations and support levels that chart readers were selling as signals. The article did not stop anyone. The patterns are too persuasive to give up because a statistician generated some.
The science of streaks is humbler than either side of the argument would like. In 1985 Thomas Gilovich, Robert Vallone and Amos Tversky analysed basketball shooting and concluded that the hot hand, the belief that a player who has hit several shots is more likely to hit the next, was an illusion. Three decades later Joshua Miller and Adam Sanjurjo showed that the original method contained a subtle statistical bias, and that corrected, the data suggest a modest hot hand after all. Streaks are neither always real nor always false, and careful experts misread them, in both directions, for thirty years.
Sometimes somebody does know something
The feeling that a move means something is far from stupid. Sometimes it is exactly right. Markets contain people who know more than others: about a company, about a large order that is coming, about a regulator's decision. Economists model it directly. In Albert Kyle's 1985 model an informed trader hides their buying inside ordinary noisy flow, and a market maker, unable to tell which orders are informed, moves prices against all of them a little.
That is what page 55 of this issue shows from the other side. Nineteen milliseconds after a burst of buying on Bybit, the spread there went from ten cents to $12.80. Whoever was quoting did not know whether the buyer knew something. They behaved as if they might. Market makers do not need to find the informed trader. They only need to price the possibility, and that possibility is part of every spread you cross.
Somebody usually does know something. The trouble is that the price alone cannot tell you which moves carry information and which are the coin landing heads four times in a row.
Story, then flow, then price
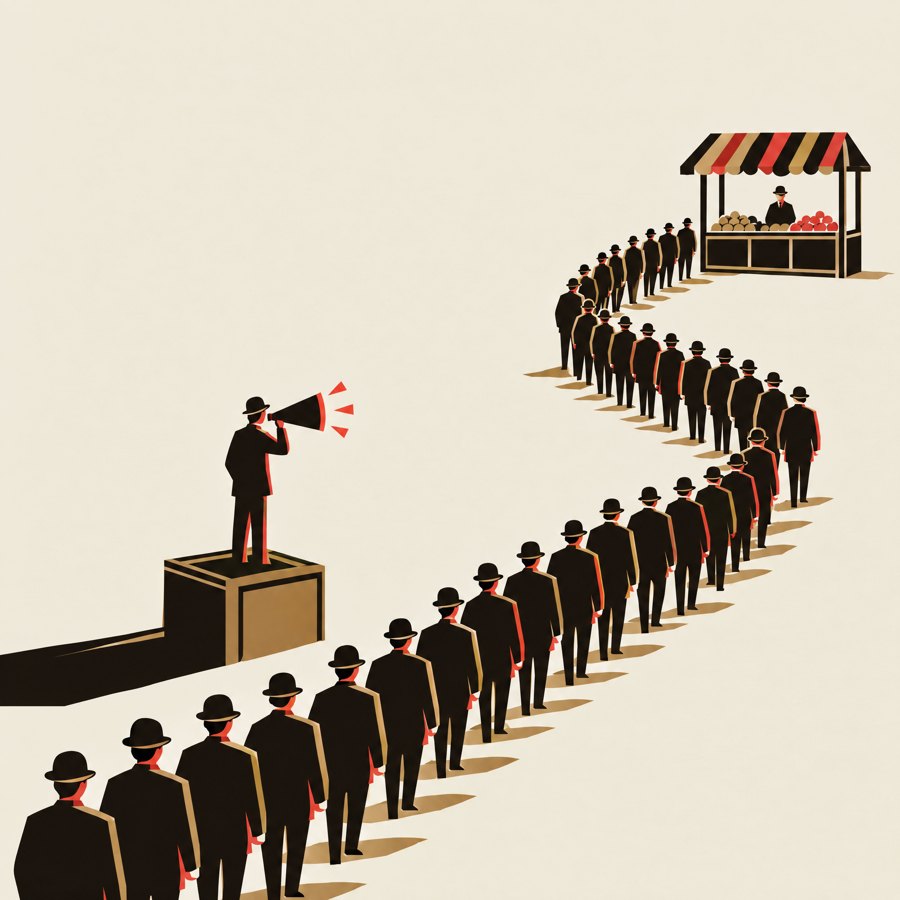
Most of the time what moves a price is a story. The economist Robert Shiller has argued that narratives spread through a population much as epidemics do, and that their spread changes what people do with money. A story becomes flow when enough people act on it. Flow becomes price when there is not enough on the other side of the book.
In January 2021 a story about a heavily shorted video game retailer spread through an online forum. Shares of GameStop, which began the month under $20, traded as high as $483 on 28 January. That morning several retail brokers restricted customers from buying more. The price fell by more than half within days. Nothing about the company's shops had changed during those weeks. The story, the flow and the book had.
The number you saw first
Patterns are one trap. The price we already know is another. In a 1974 experiment Amos Tversky and Daniel Kahneman spun a wheel of fortune, rigged to stop at 10 or at 65, in front of their subjects, then asked what share of African countries were members of the United Nations. The wheel had nothing to do with the question. Those who saw 10 gave a median answer of 25%. Those who saw 65 said 45.
Markets are full of wheels. The price you bought at, last year's high, a round number on a screen: each one pulls the next judgement towards itself. In 1998 Terrance Odean followed about 10,000 accounts at a discount broker and found that investors sold shares that had risen since purchase far more readily than shares that had fallen. The winners they sold went on to beat the losers they kept by 3.4 percentage points over the following year. The purchase price was information about the investor. They treated it as information about the share.
Page 11 asks five questions of every number, and one of them is how old it is. The price in your head is the oldest number in the room, and the only one that feels like yours.
What the patterns cost
Acting on patterns is expensive in a way that is easy to measure. In a study of more than 66,000 American brokerage households from 1991 to 1996, Brad Barber and Terrance Odean found that the fifth who traded most earned an average net return of 11.4% a year, while the market returned 17.9. Their trades were not all wrong. They were numerous, and each one paid a spread and a commission, the same arithmetic that page 40 of this issue shows for a small order in a thin book.
Nobody can stop seeing patterns. The defence is to ask, before acting on one, what it would look like if it were noise, and to remember that page 92 is the answer to that question.
A price is where stories meet money. The chart records the meeting. It does not explain it.